Download
1 / 38
380 likes | 394 Views
This study investigates various 802.11-style MACs and techniques to increase throughput in urban mesh networks. The results show how optimal spatial TDMA achieves higher throughput than CSMA/CA (such as IEEE 802.11) by eliminating collisions and ordering packets optimally.

E N D
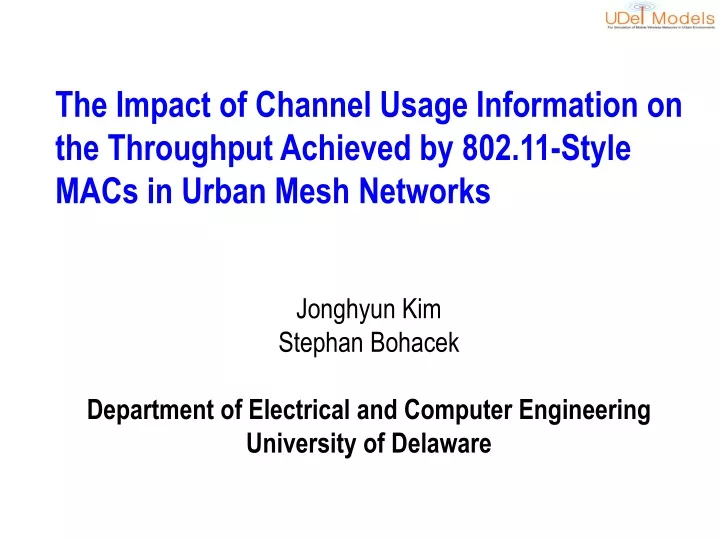
The Impact of Channel Usage Information on the Throughput Achieved by 802.11-Style MACs in Urban Mesh Networks Jonghyun Kim Stephan Bohacek Department of Electrical and Computer Engineering University of Delaware
Outline Introduction Throughput Metric Date-Rate Selection IEEE 802.11 Variants Idealized 802.11-style MACs Simulation Environment Simulation Results Conclusions
Introduction • Why does optimal spatial TDMA (STDMA) achieve higher throughput than CSMA/CA such as IEEE 802.11? • By eliminating collisions • By ordering packets in an optimal way
Introduction Destination : A A C Destination : B (same side) W X GW Y Z T1 B D A C W X GW Y Z Wait 1 T2 B D A C T3 W X GW Y Z Wait 2 B D A C T4 W X GW Y Z B D
Introduction Destination : A A C Destination : C (opposite side) W X GW Y Z T1 B D A C W X GW Y Z Wait 1 T2 B D A C T3 W X GW Y Z B D GW can transmit 50% sooner
Introduction • Goal • Investigate how to increase the throughput by various 802.11-style MACs with different techniques and extending channel usage information so that the throughput may approach gradually and maximally to the throughput achieved by optimal STDMA. • Investigate the main reasons (with percentage information) that optimal STDMA achieves higher throughput than 802.11
Introduction • Topology : Gateway : Destination (mesh node) Downtown Chicago (2kmx2Km) 3 Gateways with18 destinations
Outline Introduction Throughput Metric Date-Rate Selection IEEE 802.11 Variants Idealized 802.11-style MACs Simulation Environment Simulation Results Conclusions
Throughput Metric 500 450 2 400 Throughput F bps Peak 350 4 flow1 300 1 g(F) (Kbps) 250 3 flow1 5 flow2 200 flow3 flow4 6 flow5 150 flow6 100 200 250 300 350 400 450 500 500 F (Kbps)
Outline Introduction Throughput Metric Date-Rate Selection IEEE 802.11 Variants Idealized 802.11-style MACs Simulation Environment Simulation Results Conclusions
Data-Rate Selection 40 Peak 35 SNR = 18 dB 30 SNR1 Data-rate 25 Effective data rate (Mbps) 20 Link 1 15 10 5 0 0 10 20 30 40 50 60 R (Mbps)
Outline Introduction Throughput Metric Date-Rate Selection IEEE 802.11 Variants Idealized 802.11-style MACs Simulation Environment Simulation Results Conclusions
IEEE 802.11 Variants • Standard 802.11 overhearing S1 S2 DATA DATA ACK R1 overhearing R2 Node S1 Layer State NAV DIFS BO DIFS BO remaining MAC time DATA frame from S2 ACK frame from R2 Receive PHY time T1 DATA frame to R1 Transmit time DIFS BO Busy DIFS BO Transmit
IEEE 802.11 Variants • Stomp S1 S2 DATA ACK R1 R2 Layer State DIFS BO MAC time DATA frame from S2 Receive time PHY Decode PLCP header Transmit time DIFS BO
IEEE 802.11 Variants • Stomp SNRS1-S2 Red characters : channel usage information S1 knows S1 S2 SNRS1-R2 SNRS1-R1 SNRS2-R2 SNRR1-S2 Data-rate Data-rate R1 R1 SNRR1-R2 R2 Layer State DIFS BO BO remaining MAC time DATA frame from S2 Receive time PHY Decode PLCP header DATA frame to R1 Transmit time DIFS BO Transmit
IEEE 802.11 Variants • Packet Reordering Buffer Packet (destination = A) Packet (destination= B) Link 1 B S1 S2 Conflict overhearing L3 Link 2 L1 L2 DATA Link 3 A R2 No conflict Link 2
IEEE 802.11 Variants • Capture of Stronger Signals S1 R S2 R DATA frame from S2 Receive time PHY T1 DATA frame from S1 Receive time T2 Received power PS1 PS2 PS1 PS2 time
Outline Introduction Throughput Metric Date-Rate Selection IEEE 802.11 Variants Idealized 802.11-style MACs Simulation Environment Simulation Results Conclusions
Idealized 802.11-Style MACs • Transmitter-Transmitter Regional Channel Usage Information (TTCUI) T5 R5 T2 T3 Transmitting nodes : T2 R2 T4 T5 T6 36Mbps region 6Mbps region T1 R1 R3 T3 R4 T4 T4 R6 T6 Idealized version of 802.11 without RTS/CTS
Idealized 802.11-Style MACs • Transmitter-Transmitter Regional Channel Usage Information (TTCUI) 36Mbps region T1 R1 Cause a collision R4 T4
Idealized 802.11-Style MACs • Transmitter Regional Channel Usage Information (TCUI) T2 T3 Transmitting nodes : T2 R2 Receiving nodes : R2 R4 36Mbps region T1 R1 R3 T3 R4 T4 Half idealized version of 802.11 with RTS/CTS
Idealized 802.11-Style MACs • Transmitter Regional Channel Usage Information (TCUI) Cause a collision 36Mbps region T1 R1 T5 R5
Idealized 802.11-Style MACs • Transmitter and Receiver Regional Channel Usage Information (TRCUI) T6 T2 R2 R6 T1 R1 T5 R5 R7 R3 T3 R4 T4 T7 T2 T3 T4 T5 Transmitting nodes : Receiving nodes : R2 R4 Idealized version of 802.11 with RTS/CTS
Idealized 802.11-Style MACs • Global Channel Usage Information T6 T2 R2 R6 T1 R1 T5 R5 R7 R3 T3 R4 T4 T7 T2 T3 T4 T5 T6 T7 Transmitting nodes : Receiving nodes : R2 R3 R4 R5 R6 R7
Outline Introduction Throughput Metric Date-Rate Selection IEEE 802.11 Variants Idealized 802.11-style MACs Simulation Environment Simulation Results Conclusions
Simulation Environment • Simulation Set-up
T2 R2 6Mbps region T2 R2 T2 R2 6Mbps region T1 R1 T5 R5 6Mbps region 6Mbps region T1 R1 T1 R1 R3 T3 R4 T4 R3 T3 R4 T4 R3 T3 R4 T4 Simulation Environment • MAC types Stomp, packet reordering, capture of stronger signals Idealized
Outline Introduction Throughput Metric Date-Rate Selection IEEE 802.11 Variants Idealized 802.11-style MACs Simulation Environment Simulation Results Conclusions
T2 R2 T2 R2 T2 R2 T1 R1 T5 R5 T1 R1 T1 R1 R3 T3 R4 T4 R3 T3 R4 T4 R3 T3 R4 T4 Simulation Results # of gateways = 1 # of gateways = 3 # of gateways = 5 3.5 3.5 3.5 3 3 3 2.5 2.5 2.5 Ratio of throughput 2 2 2 1.5 1.5 1.5 1 1 1 0.5 0.5 0.5 20 40 60 80 100 20 40 60 80 100 20 40 60 80 100 # of destinations A (Without RTS/CTS) – baseline B (With RTS/CTS) C (With CTS-to-self ) D (Aloha) E (Without RTS/CTS and capture of stronger signal) F (Without RTS/CTS and with stomp, packet reordering, capture of stronger signal ) G (TTCUI) H (TCUI) I&J (TRCUI & GK) K (Optimal STDMA)
Outline Introduction Throughput Metric Date-Rate Selection IEEE 802.11 Variants Idealized 802.11-style MACs Simulation Environment Simulation Results Conclusions
Conclusion • Significant improvement does not occur with perfect knowledge of only nearby transmitters. • Significant improvement starts to occur with perfect knowledge of nearby transmitters and receivers. • Half collisions will occur with knowing perfect channel activity around only transmitter. • Half performance improvement by optimal STDMA is because of elimination of collisions. The other is because of ordering packets in an optimal way.
Thanks Any questions, comments, suggestions ? E-mail : jonghyun@udel.edu bohacek@udel.edu
UDel Models – Website http://udelmodels.eecis.udel.edu
0 10 -1 10 6Mbps 9Mbps Prob. of bit error 12Mbps -2 10 18Mbps 24Mbps 36Mbps -3 48Mbps 10 54Mbps -4 10 -15 -10 -5 0 5 10 15 20 SNR (dB) Extra Slides
Extra Slides Frame in 802.11a PHY Question : How much collision occur in this scheme? CBR data size = 1344 bytes UDP header size = 8 IP header size = 20 DATA MAC header size = 28 MSDU size = 1372 PSDU size = 1400 bytes SIFS = 16 us DIFS = 34 us EIFS = 94 us SLOT_TIME = 9 us CW_MIN = 15 (contention window) CW_MAX = 1023 For DATA PLCP preamble 96 bits Signal 24 bits Service 16 bits MAC Hdr 28 bytes MSDU 1372 bytes Tail 6 bits Pad Duration = 4.44 us Duration = 203.37 us Duration = 20 us Bit rate = 6 Mbps (fixed) Bit rate = 54 Mbps (varies) Our objective is to use the channel during this time if conditions are satisfied based on sender, receiver, and duration from DATA MAC header. • Conditions • If receiver is not the node that is now receiving the frame above. • If the link between sender and receiver is not a carrier sensing neighbor of the link between this node and the node’s receiver which is determined later if MAC does not have a frame received from network layer now or it already have a frame, but it stops counting back-off due to channel busy. Need to adjust back-off time.
This is the current last point # of trials are increased in four times Tracking line (B point) Tracking line (A points) Confidence Interval Golden Section Method and bootstrap to find confidence interval are used to find optimal capacity (i.e., bit rate) in urban mesh network.
T2 R2 T2 R2 6Mbps region 6Mbps region T1 R1 T1 R1 R3 T3 R4 T4 R3 T3 R4 T4
T2 R2 6Mbps region 6Mbps region T1 R1 T5 R5 R3 T3 R4 T4