Download

1 / 18
190 likes | 413 Views
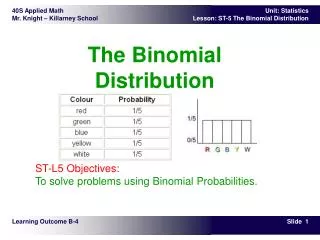
The Binomial Distribution. Karl L. Wuensch Department of Psychology East Carolina University. A Binomial Experiment. consists of n identical trials. each trial results in one of two outcomes, a “success” or a “failure.”

E N D
The Binomial Distribution Karl L. Wuensch Department of Psychology East Carolina University
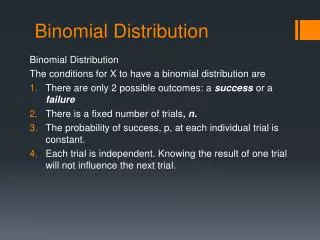
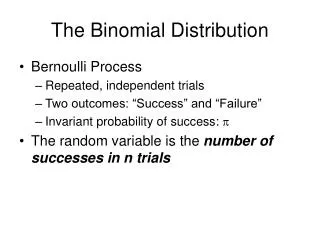
A Binomial Experiment • consists of n identical trials. • each trial results in one of two outcomes, a “success” or a “failure.” • the probabilities of success ( p) and of failure ( q= 1 ‑ p ) are constant across trials. • trials are independent, not affected by the outcome of other trials. • Y is the number of successes in n trials.
P(Y = y) may also be determined by reference to a binomial table. • The binomial distribution has:
Binomial Hypotheses, Directional • H0: Mothers cannot identify their babies by scent alone, binomial p .5 • H1: Yes they can, binomial p > .5 • The data: 18 of 25 mothers correctly identified their baby. • P(Y > 18 | n = 25, p = .5) = .022
Mothers were allowed to smell two articles of infant’s clothing and asked to pick the one which was their infant’s. They were successful in doing so 72% of the time, significantly more often than would be expected by chance, exact binomial p (one-tailed) = .022.
Inheritance of Fearfulness • John Paul Scott and John Fuller • Basenji x Basenji fearful pups • Cocker x Cocker fearless pups • Basenji x Cocker fearful pups • Dominant F gene codes for Fearfulness • Recessive f gene codes for fearlessness • F1 dogs are heterozygous, Ff
Binomial Hypotheses: Nondirectional • H0: 75% of the babies will fear strangers, binomial p = .75. • H1: binomial p .75 • The data: 18 of 25 puppies were fearful of strangers. • Under the null, we expect 75% of pups to be fearful. 18/25 = 72% were. • psig = 2P(Y 18 | n = 25, p = .75)
“p = 2*PROBBNML(.75, 25, 18);” • p = .8778 • The high value of p indicates very good fit between the null hypothesis and the data.
Eighteen of 25 pups (72%) born to F1 parents were fearful of strangers. The obtained proportion was not significantly different from the expected .75, p = .88
Normal Approximation • If falls within 0 to n, then the binomial approximation should be good. • We want P(Y ≥ 18 | n = 25, p = .5). • which is contained within 0 25, so approximation should be good.
Correction for Continuity • When computing the z, move the observed value of Y one-half point towards the mean under the null. • psig = .0228
The Binomial Sign Test • Design = Matched Pairs • Pre and post data for patients given a blood pressure treatment • Of 10 patients, 9 had lower pressure at post-test. • Under the null of no effect of treatment, we expect .5(11) = 5.5 lower and 5.5 higher.
H0: The treatment has no effect on blood pressure, binomial p= .5 • H1: The treatment does affect blood pressure, binomial p .5 • 2P(Y 9 n = 10, p = .5) = .022
An exact binomial sign test indicated that the treatment significantly lowered blood pressure, 9 of 10 patients having post-treatment pressure lower than their pre-treatment pressure, p = .022.