Download
1 / 90
900 likes | 924 Views
This study examines prevalent ESRD patient data, deaths, and expenditures in 1999, analyzing relative costs in various patient groups and Medicare payments.

E N D
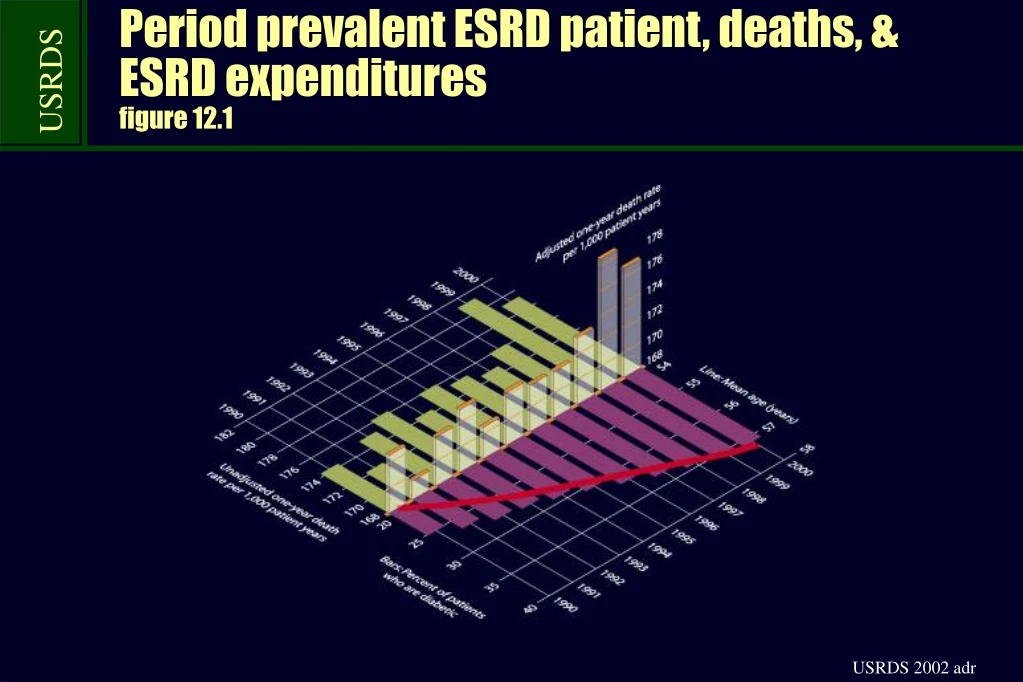
Period prevalent ESRD patient, deaths, & ESRD expendituresfigure 12.1
Costs of the ESRD & Medicare programsfigure 12.2, dollars in 2000 are inflated by 2% to account for costs incurred not reported
Percent change in allowable PMPMtable 12.a, incident dialysis patients, 1999
Relative costs: diabeticfigure 12.3, incident hemodialysis patients, 1999, adjusted
Relative costs: non-diabeticfigure 12.3, incident hemodialysis patients, 1999, adjusted
Relative costs: hemodialysisfigure 12.3, incident hemodialysis patients, 1999, adjusted
Relative costs: peritoneal dialysisfigure 12.3, incident hemodialysis patients, 1999, adjusted
Relative costs: diabetic Part Afigure 12.4, incident hemodialysis patients, 1999, adjusted, reference population indicated by patterned bars
Relative costs: diabetic Part Bfigure 12.4, incident hemodialysis patients, 1999, adjusted, reference population indicated by patterned bars
Relative costs: non-diabetic Part Afigure 12.4, incident hemodialysis patients, 1999, adjusted, reference population indicated by patterned bars
Relative costs: non-diabetic Part Bfigure 12.4, incident hemodialysis patients, 1999, adjusted, reference population indicated by patterned bars
Unadjusted allowable per member per month (PMPM) costs: diabeticfigure 12.5, incident hemodialysis patients, 1999
Unadjusted allowable per member per month (PMPM) costs: non-diabeticfigure 12.5, incident hemodialysis patients, 1999
Unadjusted allowable per member per month (PMPM) costs: hemodialysisfigure 12.6, incident dialysis patients, 1999
Unadjusted allowable per member per month (PMPM) costs: peritoneal dialysisfigure 12.6, incident dialysis patients, 1999
Part A & Part B Medicare paymentstable 12.b, incident hemodialysis patients, 1999
1 · All • 2 · Medicaid only • 3 · Medicare only • 4 · Medicare with other • 5 · Medicare & Medicaid • 6 · Medicare & EGHP • 7 · DVA or other • 8 · EGHP only • 9 · None Patient characteristics: agefigure 12.7, incident ESRD patients, 1999
1 · All • 2 · Medicaid only • 3 · Medicare only • 4 · Medicare with other • 5 · Medicare & Medicaid • 6 · Medicare & EGHP • 7 · DVA or other • 8 · EGHP only • 9 · None Patient characteristics: genderfigure 12.7, incident ESRD patients, 1999
1 · All • 2 · Medicaid only • 3 · Medicare only • 4 · Medicare with other • 5 · Medicare & Medicaid • 6 · Medicare & EGHP • 7 · DVA or other • 8 · EGHP only • 9 · None Patient characteristics: racefigure 12.7, incident ESRD patients, 1999
1 · All • 2 · Medicaid only • 3 · Medicare only • 4 · Medicare with other • 5 · Medicare & Medicaid • 6 · Medicare & EGHP • 7 · DVA or other • 8 · EGHP only • 9 · None Patient characteristics: Hispanic ethnicityfigure 12.7, incident ESRD patients, 1999
1 · All • 2 · Medicaid only • 3 · Medicare only • 4 · Medicare with other • 5 · Medicare & Medicaid • 6 · Medicare & EGHP • 7 · DVA or other • 8 · EGHP only • 9 · None Patient characteristics: primary diagnosisfigure 12.7, incident ESRD patients, 1999
1 · All • 2 · Medicaid only • 3 · Medicare only • 4 · Medicare with other • 5 · Medicare & Medicaid • 6 · Medicare & EGHP • 7 · DVA or other • 8 · EGHP only • 9 · None Patient characteristics: diabetic statusfigure 12.7, incident ESRD patients, 1999
1 · All • 2 · Medicaid only • 3 · Medicare only • 4 · Medicare with other • 5 · Medicare & Medicaid • 6 · Medicare & EGHP • 7 · DVA or other • 8 · EGHP only • 9 · None Medicare allowable PMPM net pay:total costsfigure 12.8, incident ESRD patients, 1999
1 · All • 2 · Medicaid only • 3 · Medicare only • 4 · Medicare with other • 5 · Medicare & Medicaid • 6 · Medicare & EGHP • 7 · DVA or other • 8 · EGHP only • 9 · None Medicare allowable PMPM net pay:Part A costs, diabeticfigure 12.9, incident ESRD patients, 1999
1 · All • 2 · Medicaid only • 3 · Medicare only • 4 · Medicare with other • 5 · Medicare & Medicaid • 6 · Medicare & EGHP • 7 · DVA or other • 8 · EGHP only • 9 · None Medicare allowable PMPM net pay:Part A costs, non-diabeticfigure 12.9, incident ESRD patients, 1999
1 · All • 2 · Medicaid only • 3 · Medicare only • 4 · Medicare with other • 5 · Medicare & Medicaid • 6 · Medicare & EGHP • 7 · DVA or other • 8 · EGHP only • 9 · None Medicare allowable PMPM net pay:Part B costs, diabeticfigure 12.10, incident ESRD patients, 1999, by diabetic status
1 · All • 2 · Medicaid only • 3 · Medicare only • 4 · Medicare with other • 5 · Medicare & Medicaid • 6 · Medicare & EGHP • 7 · DVA or other • 8 · EGHP only • 9 · None Medicare allowable PMPM net pay:Part B costs, non-diabeticfigure 12.10, incident ESRD patients, 1999, by diabetic status
Medicare ESRD inpatient utilization hospitalizationstable 12.c, per 100 patient years, period prevalent dialysis patients
Medicare ESRD inpatient utilization hospitalizations: age & genderfigure 12.11, per 100 patient years, period prevalent dialysis patients
Medicare ESRD inpatient utilization hospitalizations: race & primary diagnosisfigure 12.11, per 100 patient years, period prevalent dialysis patients
Trends in total expenditures & expenditures per patient yearfigure 12.12, period prevalent ESRD patients
Change in total expenditures & subgroups, 1991–2000: all patientsfigure 12.13, period prevalent ESRD patients Pts · Total patients Total · Total expenditures IP · Inpatient OP · Outpatient SN · Skilled nursing HH · Home health HS · Hospice PS · Physician/supplier
Change in total expenditures & subgroups, 1991–2000: dialysis onlyfigure 12.13, period prevalent ESRD patients Pts · Total patients Total · Total expenditures IP · Inpatient OP · Outpatient SN · Skilled nursing HH · Home health HS · Hospice PS · Physician/supplier
Change in total expenditures & subgroups, 1991–2000: new transplant within the yearfigure 12.13, period prevalent ESRD patients Pts · Total patients Total · Total expenditures IP · Inpatient OP · Outpatient SN · Skilled nursing HH · Home health HS · Hospice PS · Physician/supplier
Change in total expenditures & subgroups, 1991–2000: functioning graftfigure 12.13, period prevalent ESRD patients Pts · Total patients Total · Total expenditures IP · Inpatient OP · Outpatient SN · Skilled nursing HH · Home health HS · Hospice PS · Physician/supplier
Change in total expenditures & subgroups, 1991–2000: graft failure during the yearfigure 12.13, period prevalent ESRD patients Pts · Total patients Total · Total expenditures IP · Inpatient OP · Outpatient SN · Skilled nursing HH · Home health HS · Hospice PS · Physician/supplier
Change in expenditures per patient year, 1991–2000: all patientsfigure 12.14, period prevalent ESRD patients Pts · Total patients Total · Total expenditures IP · Inpatient OP · Outpatient SN · Skilled nursing HH · Home health HS · Hospice PS · Physician/supplier
Change in expenditures per patient year, 1991–2000: dialysis onlyfigure 12.14, period prevalent ESRD patients Pts · Total patients Total · Total expenditures IP · Inpatient OP · Outpatient SN · Skilled nursing HH · Home health HS · Hospice PS · Physician/supplier
Change in expenditures per patient year, 1991–2000: new transplant within the yearfigure 12.14, period prevalent ESRD patients Pts · Total patients Total · Total expenditures IP · Inpatient OP · Outpatient SN · Skilled nursing HH · Home health HS · Hospice PS · Physician/supplier
Change in expenditures per patient year, 1991–2000: functioning graftfigure 12.14, period prevalent ESRD patients Pts · Total patients Total · Total expenditures IP · Inpatient OP · Outpatient SN · Skilled nursing HH · Home health HS · Hospice PS · Physician/supplier
Change in expenditures per patient year, 1991–2000: graft failure during the yearfigure 12.14, period prevalent ESRD patients Pts · Total patients Total · Total expenditures IP · Inpatient OP · Outpatient SN · Skilled nursing HH · Home health HS · Hospice PS · Physician/supplier
Trends in the Medicare risk population: ESRD risk patientsfigure 12.15, period prevalent patients in each year
Trends in the Medicare risk population: ESRD risk monthsfigure 12.15, period prevalent patients in each year
Trends in the Medicare risk population: general Medicare risk patientsfigure 12.15, period prevalent patients in each year
Percent of Medicare risk patients: 1990figure 12.16, ESRD patients enrolled in Medicare + Choice managed care organizations Percent of patients 6.34+ (7.66) 1.87 to <6.34 1.00 to <1.87 0.31 to <1.00 below 0.31 (0.10)
Percent of Medicare risk patients: 1995figure 12.16, ESRD patients enrolled in Medicare + Choice managed care organizations Percent of patients 6.34+ (9.34) 1.87 to <6.34 1.00 to <1.87 0.31 to <1.00 below 0.31 (0.14)
Percent of Medicare risk patients: 2000figure 12.16, ESRD patients enrolled in Medicare + Choice managed care organizations Percent of patients 6.34+ (11.76) 1.87 to <6.34 1.00 to <1.87 0.31 to <1.00 below 0.31 (0.13)
Medicare risk patients: Modality distribution in HMO & non-HMO groups figure 12.17, point prevalent ESRD patients on 1/1/2000
Number of Medicare risk patients, by metropolitan statistical areas figure 12.18, period prevalent ESRD patients, 2000 Metropolitan Statistical Areas (MSAs) with the greatest numbers of Medicare risk patients 1-Los Angeles-Long Beach, CA 11. Boston, MA 2-New York, NY 12. Ft. Lauderdale, FL 3-Philadelphia, PA 13.Orange County, CA 4-Riverside-San Bernardino, CA 14. Pittsburgh, PA 5-Oakland, CA 15. Sacramento, CA 6-Chicago, IL 16. Denver, CO 7-Miami, FL 17. Tampa-St. Petersburg, FL 8-Phoenix, AZ 18. Cleveland, OH 9-San Diego, CA 19. San Jose, CA 10-San Francisco 20. Houston, TX 21. Portland, OR 22. St. Louis, MO 23. Washington, DC 24. Palm Beach, FL 25. San Antonio, TX MSA (see table for details)
Percent of Medicare risk patientsfigure 12.18, period prevalent ESRD patients, 2000, by MSA & HSA, unadjusted Percent of patients 3.43+ (9.03) 0.67 to <3.43 0.27 to <0.67 0.11 to <0.27 below 0.11 (0.06)