Download
1 / 38
380 likes | 499 Views
Crop Insurance and the 2013(?) Farm Bill. Paul D. Mitchell Associate Professor of Agricultural & Applied Economics University of Wisconsin-Madison Tri-State Ag Lenders Meeting Dubuque, IA October 30, 2013. Today’s Goal. O verview of existing Farm Programs

E N D
Crop Insurance and the 2013(?) Farm Bill Paul D. Mitchell Associate Professor of Agricultural & Applied Economics University of Wisconsin-Madison Tri-State Ag Lenders Meeting Dubuque, IA October 30, 2013
Today’s Goal • Overview of existing Farm Programs • How and where we spend about $15 billion/year • Overview of likely changes in programs • 7-9% cut in the $15 billion • Even more emphasis on crop insurance
USDA spends about $100 billion/year (~3%), mix of mandatory & discretionary
Most of the USDA budget is for Nutrition Programs (SNAP/Food Stamps, WIC, School Lunch Program) <1% 6% 15% 79%
Average Annual Outlays Under 2008 Farm Bill Direct Payments (DP) $4.9 bil Crop Insurance $8.3 bil Counter-Cyclical Payments (CCP) $0.559 bil Risk Management (field & specialty crops) $8.4 bil Commodity Programs (field crops) $6.0 bil OR Average Crop Revenue Election (ACRE) $0.311 bil Farm Safety Net $15 bil Non-insured Disaster Assistance (NAP) $0.1 bil Marketing Assistance Loans $0.225 bil Loan Deficiency Payments (LDP) $0.225 bil Supplemental Revenue Assistance Payments Program (SURE) Livestock Indemnity Program Ad hoc disaster payments Livestock Forage Disaster Program Disaster Assistance (crops & livestock) $0.75 bil Emergency Assistance for Livestock, Honey Bees, and Farm-Raised Fish Program Tree Assistance Program Emergency Disaster Loans Source: http://ncseonline.org/NLE/CRSreports/10Oct/R41317.pdf
Direct Payments $/ac in 2009 Source: USDA-ERS Farm Program Atlas http://www.ers.usda.gov/data-products/farm-program-atlas/go-to-the-atlas.aspx#.UgvP3pLCY6k
Counter-Cyclical Payments $/ac in 2009 Source: USDA-ERS Farm Program Atlas http://www.ers.usda.gov/data-products/farm-program-atlas/go-to-the-atlas.aspx#.UgvP3pLCY6k
Marketing Loan Benefits $/ac in 2009 Source: USDA-ERS Farm Program Atlas http://www.ers.usda.gov/data-products/farm-program-atlas/go-to-the-atlas.aspx#.UgvP3pLCY6k
ACRE Payments $/ac in 2009 Source: USDA-ERS Farm Program Atlas http://www.ers.usda.gov/data-products/farm-program-atlas/go-to-the-atlas.aspx#.UgvP3pLCY6k
SURE Disaster Payments $/ac 2009 Source: USDA-ERS Farm Program Atlas http://www.ers.usda.gov/data-products/farm-program-atlas/go-to-the-atlas.aspx#.UgvP3pLCY6k
MILC Payments 2009 Source: USDA-ERS Farm Program Atlas http://www.ers.usda.gov/data-products/farm-program-atlas/go-to-the-atlas.aspx#.UgvP3pLCY6k
% Net Cash Income from Govt. Payments (not including premium subsidies or indemnities)
Main Point • Roughly $7 billion in commodity support • Direct Payments dominate commodity support spending • Spread all around, but big in the South • Counter-Cyclical Payments: Only in the South • Commodity payments have constituted 5% to 40% of Net Farm Income over the last decade • No disaster program (SURE) for 2012, though crop yields were low, grain farmers not asking for disaster aid – Why? • Crop insurance took care of the problem! • Let’s take a closer look at where the $8 billion in crop insurance fits into commodity support
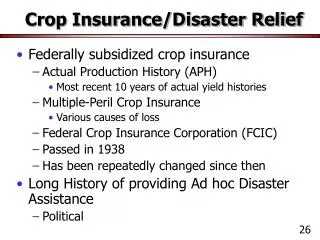
Crop Insurance Subsidies • Administered by USDA-Risk Management Agency (RMA) and Federal Crop Insurance Corporation (FCIC) • USDA develops policies, rules, and premium rates • Development & administration costs paid by the public • USDA subsidizes the premiums • Farmers pay ~35% to 45% of fair premiums on average • USDA pays subsidy to companies for Administration and Operating (A&O) ~18%-20% of total premiums • FCIC reinsures the insurance companies, plus retains some of the policies • Means FCIC (govt) pays some of the indemnities
Crop Insurance Data for 2012 (all units in Millions) • Premium subsidies = $6.9 billion (65% WI, 63% US) • Subsidies to companies $1.3 billion • USDA administration costs = ???, govt indemnities = ???
Crop Insurance Data for 2012 • Corn and Soybeans dominate crop insurance • USA: 50% of the acres, 60% of the subsidies, almost 70% of the liability and 80% of the indemnities in 2012 • Corn and soybeans dominate US crops: corn and soy were 66% of the farm gate value of all US crops in 2011
Main Point • $8 billion direct govt. spending on crop insurance • $6.9 billion premium subsidies + $1.3 billion A&O • Farmers pay $4.1 billion of $11.0 billion total premium • If priced “fairly”, farmers spend $4.1 billion to get $11.0 billion in average indemnities ($2.68 for each $1 spent) • Crop insurance has become the primary mechanism federal govt. uses to support commodity agriculture • Where geographically does that money go?
2009 Total Payments (DCP, ACRE, LDP, SURE, MILC, CRP, Premium Subsidies)
Share of 2009 Total Payments from Crop Insurance Premium Subsidies
Main Point • Crop insurance popular in many regions: • Western Corn Belt, High Plains, Lower Mississippi River Valley, Piedmont • Premium subsidies and net indemnities • Exceed commodity payments in many regions • More significant in “fringe” production areas • Farm Bill proposals and passed versions emphasize crop insurance even more, usually to benefit Midwestern corn and soy farmers more
2013? Farm Bill • Senate passed Farm Bill • House passed a Farm Bill without nutrition programs • Conference committee starts today! • Will we see a Farm Bill in 2013??? • Quick summary of 2013 Farm Bills
Proposed Commodity Program Changes • Direct Payments: both eliminated • Counter-Cyclical Payments: both eliminated • ACRE Program: both eliminated • Disaster Programs: both eliminated SURE • Keep other programs (LIP, LFP, ELAP, TAP) • Marketing Assistance Loans and Loan Deficiency Payments: both kept with the same loan rates • Create new Farm Safety Nets with new acronyms
Differ on Farm Safety Net • Keep price support like Counter-Cyclical program • New acronyms, basically same program • Create “Shallow Loss” programs for losses not covered by crop insurance • Programs sit on top of crop insurance and cover part of “farmer deducible” • With a 75% RP policy, farmer “pays” the first 25% of revenue losses below average revenue • Shallow Loss programs pick up part of this deductible (for free)
Price Support Programs • House: Price Loss Coverage (PLC) • Fixed target prices (i.e., $2.63 and $6.00) • Planted acres, but limited by historical base acres • Senate: Adverse Market Payments (AMP) • Target prices = 55% of 5 year Olympic average • (In 2014, $2.83 for corn and $6.19 for soybean) • Historical base acres
Shallow Loss Commodity Support Programs • Senate: Agriculture Risk Coverage (ARC) • House: Revenue Loss Coverage (RLC) • ARC & RLC similar to ACRE program that sits on top of crop insurance, but at county or farm level • Farmer pays first 11%-15% of losses, ARC/RLC cover up to 10% of additional losses, with any additional losses covered by crop insurance • 75% Revenue Protection is most popular policy
Shallow Loss Commodity Support Programs • Differences between ARC and RLC • % losses farmer pays first (11% or 15%) • County revenue or farm revenue for guarantee • Agreements between ARC and RLC • Only cover an additional 10% of losses, greater losses covered by crop insurance • Use 5-year Olympic average of yields & prices • Not farm yields or futures prices • Meant to help with multi-year losses/trends, not short-term annual losses like crop insurance
Supplemental Coverage Option (SCO) • Additional shallow loss coverage farmers can buy • If covering 11% to 15% of deductible losses is too much, use Supplemental Coverage Option (SCO) • Buy a GRIP county revenue policy for the part of the RP crop insurance deductible not covered by ARC/RLC • SCO sits on top of individual crop insurance coverage and layered with ARC/RLC
Other Likely Changes to Expect • Greater use of crop insurance as a policy tool for non-risk management purposes • Reduced Insurance Premium Subsidies: the new fiscal and political reality • A small % for everyone and/or pay much higher % of premiums if exceed an AGI limit • Tighten payment limits • Conservation Compliance for crop insurance • Will need non-ag votes to pass Farm Bill
Proposed Changes ($ Billion per Year)Source: http://www.fas.org/sgp/crs/misc/R43076.pdf Big Difference 7-9% cut 6-8% cut 7-9% cut 2-5% cut • Senate and House similar in dollars for Ag • Debate about how muchto cut Nutrition and how to support commodity Ag • Both emphasize crop insurance even more
Main Point • Structure of commodity support will change, but overall level will be about the same: 7% to 9% cut • Eliminate DCP, ACRE, and SURE disaster program to create new Price Support (PLC/AMP) and Shallow Loss Programs (RLC/AMP & SCO) • Crop insurance to become the foundation of commodity support with increased emphasis • Commodity support programs will sit on top of crop insurance or be layered with it
Farm Bill Expectations: My Thoughts • 3 Scenarios seem possible 1. Pass a separate Farm Bill 2. Pass a Farm Bill as part of fiscal reform/budget bill 3. Pass another extension of the 2008 Farm Bill • Price expectations are lower, tighter margins for crops • $7 corn has hidden a lot of management problems • The Party is Over! Time to get back to work • My Advice: Don’t count on the government • Crop insurance will continue, but don’t be dependent on government support payments to be profitable • Take care of your farm business, be a good farmer to maintain profits with tighter margins
Conclusion • We spend about $15 billion a year in government payments to farmers • Nationally, more than half is for crop insurance • New Farm Bill, if it ever passes, will likely cut spending at most 9% and put even more emphasis on crop insurance • Price support option will stay about the same (PLC/AMP) • New shallow loss programs will sit on top of crop insurance or be layered with it (RLC/ARC & SCO) • Subsidy limits or AGI limits for crop insurance? • Conservation compliance for crop insurance?
Thanks for Your Attention!Questions? Paul D. Mitchell Agricultural and Applied Economics University of Wisconsin, Madison, WI pdmitchell@wisc.edu 608-265-6514 http://www.aae.wisc.edu/pdmitchell/extension.htm Follow me on Twitter: @mitchelluw