Download
1 / 9
90 likes | 130 Views
Explore the impact of manipulating SCD1 and YAP/TAZ pathways on cell viability and gene expression levels. The study investigates how targeting these pathways influences cellular function and survival. The findings provide valuable insights into potential therapeutic strategies for promoting cell health.

E N D
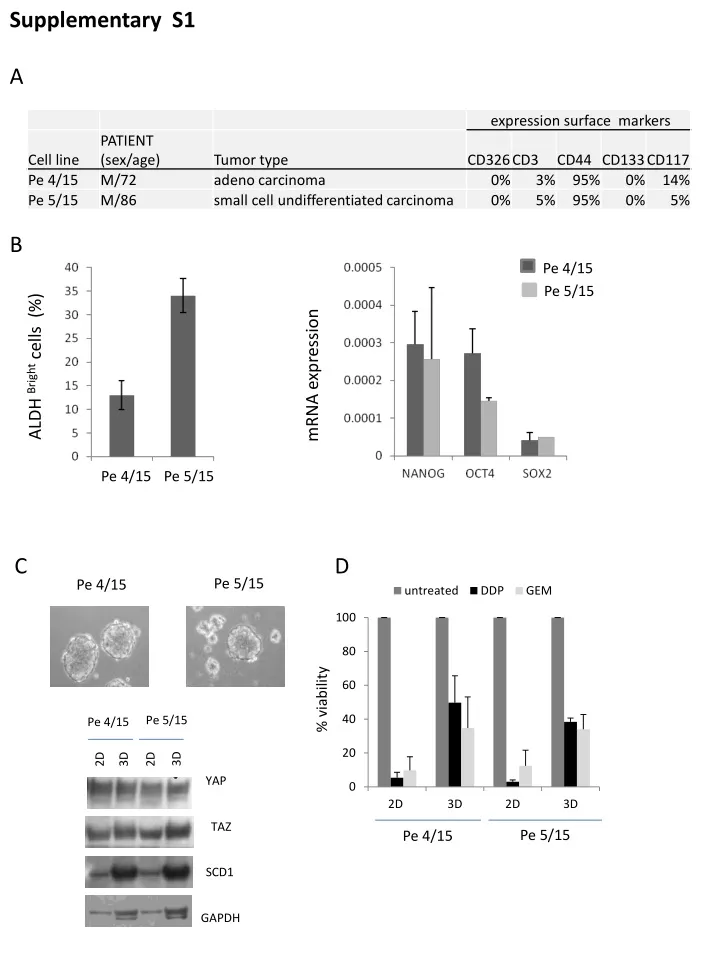
Supplementary S1 Pe 5/15 Pe 4/15 A 3D 2D 3D 2D B YAP Pe 4/15 Pe 5/15 TAZ SCD1 ALDH Bright cells (%) GAPDH mRNA expression Pe 4/15 Pe 5/15 C D Pe 5/15 Pe 4/15 % viability Pe 5/15 Pe 4/15
Supplementary S2 A B Relative mRNA level ** ** Nuclear YAP/TAZ MF-438
Supplementary S3 A B C G H I D E F L M N
Supplementary S4 CTR 30 µm 30 µm 30 µm MF-438 30 µm 30 µm 18 µm
Supplementary S5 A B C siSCD1 Pe 4/15 siCTR YAP CTR C59 RLU 8X-GTIIC ** * TAZ * Relative mRNAlevel Axin2 RLU TOP/FOP-FLASH SCD1 GAPDH YAP TAZ D E GAPDH CTR ** C59 N°spheroids/CTR ** XAV-939
Supplementary S6 - WNT + WNT A B ** * CTR N°spheroids/CTR MF-438 E - WNT C D + WNT ** ** * siCTR N°spheroids/CTR siYAP/TAZ * Viability (A.U.)
Supplementary S7 C A B ** Relative mRNA level Relative mRNA level Relative mRNA level ** * siCTR siCTR siβ-TrcP+siSCD1 siaxin1+siSCD1
Supplementary S8 scd1/taz scd1/yap 1.0 1.0 0.8 0.8 0.6 0.6 Other Other Other Other P=0.024 P=0.013 yap1_low/scd1_low taz_low/scd1_low birc5_low/scd1_low ctgf_low/scd1_low 0.4 0.4 0.2 0.2 0.0 0.0 120 100 80 0 20 60 40 120 100 0 20 40 60 80 OS scd1/birc5 scd1/ctgf 1.0 1.0 0.8 0.8 0.6 0.6 P=0.017 P=0.0004 0.4 0.4 0.2 0.2 0.0 0.0 120 100 120 80 100 0 20 60 80 40 60 0 20 40 MONTHS