Download
1 / 21
260 likes | 584 Views
Inventory. Stock of items held to meet future demand Inventory management answers two questions How much to order When to order. Market research data scheduling information Engineering and design data Order flow and cash flow. Supplier. Customer. Ideas and design to satisfy end customer

E N D
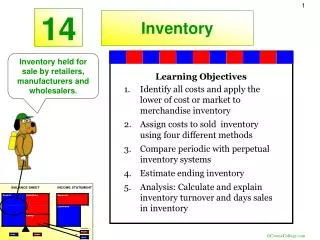
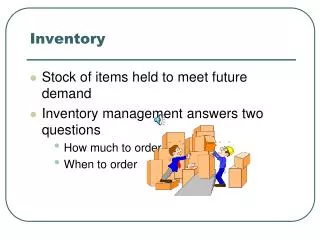
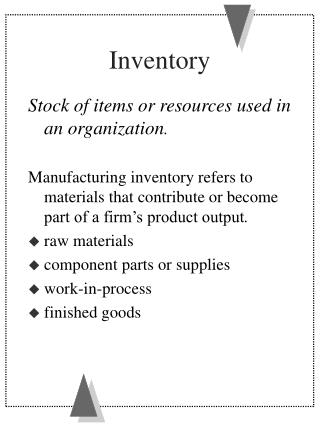
Inventory • Stock of items held to meet future demand • Inventory management answers two questions • How much to order • When to order
Market research data scheduling information Engineering and design data Order flow and cash flow Supplier Customer Ideas and design to satisfy end customer Material flow Credit flow Inventory Supplier Customer Manufacturer Inventory Inventory Supplier Customer Distributor Inventory The Supply Chain
Reasons To Hold Inventory • Meet unexpected demand • Smooth seasonal or cyclical demand • Meet variations in customer demand • Take advantage of price and quantity discounts • Hedge against price increases • Minimize impact of supply chain disruptions
Two Types Of Demand • Dependent • Demand for items depends on the number of final units that will be produced (usually well known) • Material Requirement Planning • Independent • Demand for items is determined by external customers (usually forecasted) • Economic Order Quantity (EOQ) models
Push/Pull View of Supply Chains Procurement, Customer Order Manufacturing and Cycle Replenishment cycles PUSH PROCESSES PULL PROCESSES Customer Order Arrives
Approaches to Inventory Management • Just-in-case inventory (overstocking) • Carry large inventories to ensure high customer service level (expensive!) • Just-in-time inventory (understocking) • Carry minimal inventory levels to control costs in exchange for risk of more stockouts
Inventory Costs • Carrying Cost • cost of holding an item in inventory • Ordering Cost • cost of replenishing inventory • Shortage Cost • temporary or permanent loss of sales when demand cannot be met
Inventory Control Systems • Fixed-order-quantity system (Continuous) • constant amount ordered when inventory declines to predetermined level • Fixed-time-period system (Periodic) • order placed for variable amount after fixed passage of time
Strategies for Managing Inventories in the Supply-Chain • Reduce uncertainty in supply chain • Postponement • Drop shipping • Vendor managed inventories • Radio frequency identification tags • Collaborative forecasting and planning • Every day low pricing strategies • Electronic Data Interchange (EDI)
Brainstorm strategies to manage inventories for….. • Laptops at • Dell • Best Buy • 350 GB Internal Hard Drives at • Dell • Best Buy • Paul Newman’s Ranch Salad dressing at • Ralphs • 7-Eleven • McDonalds
Deterministic Economic Order Quantity Model Assumptions • Demand is constant throughout the planning period at D items per period. • Ordering cost is $Co per order. • Holding cost is $CC per item in inventory per period. • Purchase cost per unit is constant (no quantity discount). • Delivery time (lead time) is constant. • Planned shortages are not permitted.
The (Q,r) Policy • Q is the order quantity which specifies the number of units to order for an item when it is time to replenish the inventory • r is the reorder point, the inventory position at which an order should be placed • the inventory position is the amount of inventory on hand plus the amount of inventory on order
The Inventory Order Cycle Demand rate Order qty, Q Inventory Level Reorder point, R Lead time Lead time 0 Time Order Placed Order Received Order Placed Order Received
EOQ Cost Model CO - cost of placing order D - annual demand CC - annual per-unit carrying cost Q - order quantity Annual ordering cost = COD/Q Annual carrying cost = CCQ/2 Total cost = COD/Q + CCQ/2 Class Exercise Example: CC = $0.75 per yard CO = $150 D = 10,000 yards
EOQ Model Cost Curves Slope = 0 Annual cost ($) Total Cost Minimum total cost Carrying Cost = CcQ/2 Ordering Cost = CoD/Q Optimal order Qopt Order Quantity, Q
EOQ Cost Model CO - cost of placing order D - annual demand CC - annual per-unit carrying cost Q - order quantity Annual ordering cost = COD/Q Annual carrying cost = CCQ/2 Total cost = COD/Q + CCQ/2
EOQ Example CC = $0.75 per yard CO = $150 D = 10,000 yards
When to Order Reorder Point -level of inventory at which to place a new order R = dL where d = demand rate per period L = lead time
Reorder Point Example Demand = 10,000 yds/year Store open 311 days/year Daily demand = 10,000 / 311 = 32.154 yds/day Lead time = L = 10 days R = dL = (32.154)(10) = 321.54 yds
Safety Stocks • Safety stock • buffer added to on hand inventory during lead time • Stockout • an inventory shortage • Service level • probability that the inventory available during lead time will meet demand
Reorder Point With A Safety Stock Inventory level Q Reorder point, R Safety stock 0 LT LT Time