Download
1 / 49
490 likes | 637 Views
CHILD RIGHTS DASHBOARD – Country uganda. CRSA STAGE 2: CHILD RIGHTS CONTEXT. CRSA Stage 2: Child Rights Context. Country Uganda Child Rights Dashboard – Executive Summary. Uganda has an estimated population size of 37.7 million people (52% F:48 M). 55% are children below 17 years.

E N D
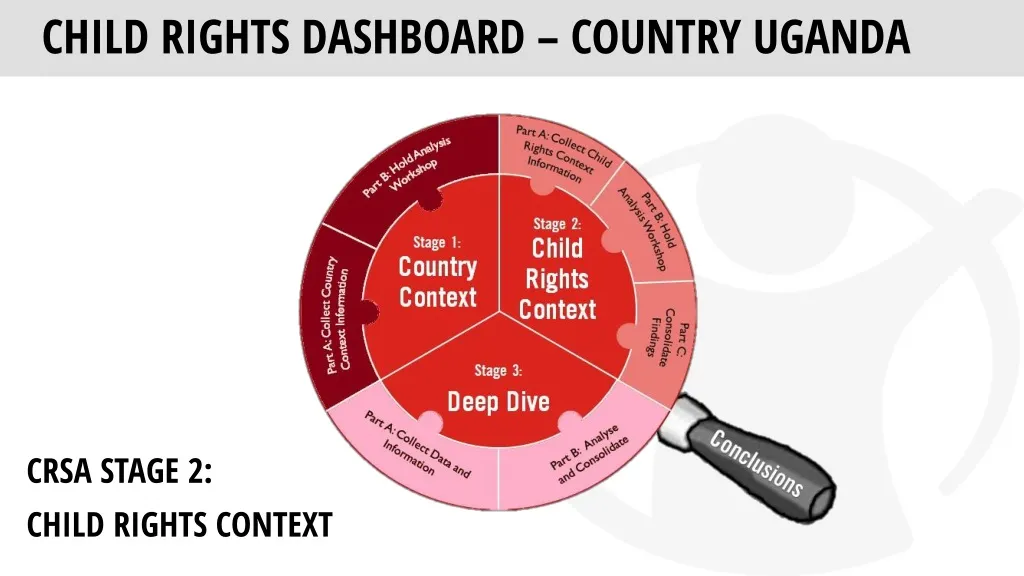
CHILD RIGHTS DASHBOARD – Country uganda CRSA STAGE 2: CHILD RIGHTS CONTEXT
CRSA Stage 2: • Child Rights Context • Country Uganda Child Rights Dashboard – Executive Summary • Uganda has an estimated population size of 37.7 million people (52% F:48 M). 55% are children below 17 years. • Between 2012/13 and 2016/17, the population of Uganda increased by about 3.6 million persons (i.e. from 34.1 million to 37.7 million). • Uganda has experience a decline in childhood mortality in 2016 with under 5 mortality at 64 per 1000 live births and infant mortality by at 43 per 1000 live births. • 29% of children under 5 years old children are stunted and 11% of children under 5 years old children are underweight. • 80% of primary 3 children can not achieve a primary 2 proficiency level in English reading and comprehension. • 30% of primary 3 children are able to achieve full competency in primary 2 numeracy skills. • 86.6% of Ugandan children are not enrolled in Early Childhood Education in 2016. • Karamoja region and West Nile region face the highest rate of multidimensional poverty at 0.634% and 0.484% • Violence against children (VAC) is high in all setting and in all its forms. Corporal punishment is common in schools. 74.3% of children especially in government schools are punished, compared to 75.6% in private schools. • Uganda hosts over 1.4 million refugees and asylum seekers, 61% are children under 17 years, 86% are women and children. • Children are exposed to sex very early with about 71% of teenagers having risky sex - less than half use condoms- Ministry of Health HIV/AIDS report of 2011. Teenager pregnancies at 25% with higher dropout rates for girls than boys
CRSA Stage 2: • Child Rights Context • BREAKTHROUGH 1: SURVIVE Neonatal mortality Under-five mortality Probability of dying during the first 28 days of life, expressed per 1,000 live births. Probability per 1,000 that new-born baby will die before age five Despite its decline, U5MR target was: 56 deaths per 1,000 live births in 2015 (MDG) *DHS2016 • Newborn mortality contributes to • 1/3 of infant mortality (first year of life), • > 1/5 of under-five mortality • *Sitannewbon health in Uganda, DHS2016
CRSA Stage 2: • Child Rights Context • BREAKTHROUGH 1: SURVIVE Neonatal mortality Newborn causes of deaths and coverage of newborn care The Neonatal Mortality Rate for younger mothers (43 per 1,000 live births) is 1.6 times higher than for mothers aged 20-29 (27 per 1,000 live births)
CRSA Stage 2: • Child Rights Context • BREAKTHROUGH 1: SURVIVE Prevalence of stunting Percentage of children under age 5 whose height for age is more than two standard deviations below the median. Data available at: GRID / GRID Trends & Projections DHS Statcompiler, MICS MoH target for stunting: <25% (Investment Plan for RMNCAH plan 2016/17-2019/20) DHS2016
CRSA Stage 2: • Child Rights Context • BREAKTHROUGH 2: LEARN Percentage of children in Primary 3 achieving at least a Primary 2 proficiency level in Local Language reading and comprehension Literacy Percentage of children in Primary 3 achieving at least a Primary 2 proficiency level in English reading and comprehension Source: “Are Our Children Learning (2016)?. Uwezo Uganda Sixth Learning Assessment Report. December 2016.
CRSA Stage 2: • Child Rights Context • BREAKTHROUGH 2: LEARN Numeracy Percentage of children in Primary 3 achieving full competence in Primary 2 numeracy skills Source: “Are Our Children Learning (2016)?. Uwezo Uganda Sixth Learning Assessment Report. December 2016. Source: “Are Our Children Learning (2016)?. Uwezo Uganda Sixth Learning Assessment Report. December 2016.
CRSA Stage 2: • Child Rights Context • BREAKTHROUGH 2: LEARN Gross early childhood education enrolment rate in pre-primary Early Childhood Development Trends in Gross early childhood education enrolment rate in pre-primary Source: “School-age Population by education level.” UNESCO 2015. http://uis.unesco.org/en/country/ug. Source: The Education and Sports Sector Annual Performance Report 2016/2017. Ministry of Education and Sports. Source: MOES Education and Sports Sector Fact Sheet. EMIS 2002-2016.
CRSA Stage 2: • Child Rights Context • BREAKTHROUGH 2: LEARN Early Childhood Development Percentage of children in Primary One who attended pre-primary and their school readiness as measured by percentage repeating Primary One Source and Image: “Are Our Children Learning?. Five Stories on the State of Education in Uganda in 2015 and Beyond. Fifth Uwezo Annual Learning Assessment. • Source: “Uganda Early Years Enrolment and Repetition: Milestone 2 Draft Report.” DFID East Africa Research Hub. RTI International. January 2018.
CRSA Stage 2: • Child Rights Context • BREAKTHROUGH 3: BE PROTECTED Physical & Humiliating Punishment Violence Against Children Proportion of children who experienced any physical punishment and/or psychological aggression by caregivers in the past month Percentage of perpetrators of violence against children in schools. . • Corporal punishment is common in schools. 74.3% of children especially children in government schools are punished, compared to 75.6% in private schools. • 82% of the children were made to do difficult work such as digging, slashing and collecting water at school as a punishment to instil discipline • 43% of children experienced bullying .The prevalence rate of bullying was higher in primary schools (46%) compared to secondary schools (31%) and affected children from poor families and those with disabilities most. -Most violence in schools is inflicted by teachers at 74% in to 67% in Northern, 67% and 60% Western and central Uganda. -441 critical and 92138 non critical cases were reported in 2017. -In households fathers and single parents are biggest perpetrators at 1,348 cases and 416 cases respectively though there is under reporting of abuse. Statistical summary report by Uganda child helpline report 2017. Source: Physical Violence, Mental Health and educational performance in Uganda, 2013 Source: National Strategic Plan on Violence Against Children in Schools (2015-2020) MOEST, 2015)
CRSA Stage 2: • Child Rights Context • BREAKTHROUGH 3: BE PROTECTED Violence Against children Top 10 reporting districts for cases of child abuse 700 600 500 400 300 200 100 0 Source: Statistical summary report by Uganda child helpline report Jan-May 2017 610 534 464 414 No. of cases 318 310 277 287 269 273 Kabale Kasese Kampala Kamuli Kyenjojo Tororo Kamwenge Buyende Wakiso Ntugamo Reporting Districts
80 % • CRSA Stage 2: • Child Rights Context • AT A GLANCE: MULTIDIMENSIONAL POVERTY 70 % 70 % 60 % 52 % 50 % Percentage of People 38 % 40 % 30 % 24 % In Severe Poverty Percentage of the Population who are MPI Poor and Deprived Percentage of People Deprived in X% or more of the MPI Weighted Indicators 20 % H 8 % 10 % 4 % 1 % 0 % 33.3%+ 40 % + 50 % + 60 % + 70 % + 80 % + 90 % + 33.3%-39.9% 40 49.9 % 59.9 % % 50 % - - 70 % 79.9 80 - 89.9 90 100 % % % % % - - 60%-69.9% Source: www.ophi.org.uk OPHI Country Briefing June 2017
CRSA Stage 2: • Child Rights Context • AT A GLANCE: MULTIDIMENSIONAL POVERTY Percentage of the Population who are MPI Poor and Deprived Percentage of the Population who are MPI poor deprived in each indicator 69.9% Ugandans are in ‘Severe Poverty’. Source: www.ophi.org.uk OPHI Country Briefing June 2017
CRSA Stage 2: • Child Rights Context • THEMATIC INDICATORS • AT A GLANCE: MULTIDIMENSIONAL POVERTY Percentage of the Population who are MPI Poor and Deprived Mapping Poverty Rates at the Sub-national Level 69.9% Ugandans are in ‘Severe Poverty’, the cut off for poverty (k) is 33.33%. Uganda MPI 0.367 Headcount Ratios of the MPI Poor and Destitute at the Sub-national Level Source: www.ophi.org.uk OPHI Country Briefing June 2017
HEALTH & NUTRITION • CRSA Stage 2: • Child Rights Context Total Fertility Rate = 5.8% 2.4% of married women used male condoms
HEALTH & NUTRITION • CRSA Stage 2: • Child Rights Context Coverage gaps of intervention against national targets
HEALTH & NUTRITION • CRSA Stage 2: • Child Rights Context Breastfeeding status National Data on the main causes of U5 mortality
CRSA Stage 2: • Child Rights Context • HEALTH & NUTRITION HIV prevalence
Teenage Pregnancies • The percentage of teenagers having beginning childbearing at 15-19 years old, reach 30.3% in North Central, 23.6% in Karamoja and 22.4% in West Nile. • Adolescent birth rate : 140 per 1,000 women 15-19 (2013)
CRSA Stage 2: • Child Rights Context • EDUCATION Access to primary education Percentage of children (rural/urban, female/male) of official primary school age attending primary school in 2016/2017 • Number of primary schools in 2016 (government/private) – 19,718 • Government primary enrolment – 7,111,680 learners in 2016 • Private primary enrolment – 1,544,244 learners in 2016 • Gender parity index of 1.02 with 50.3% female, 49.6% male • Special Needs population to total enrolment – 2.06% • Percentage of population with Special Needs – 13% • Public current expenditure on primary education as a percentage of GDP has decreased from 1.17% in 2015 to 1.02% in 2016 Source and Image: 2016/2017 Uganda National Household Survey (UNHS). Uganda Bureau of Statistic (UBOS). Final Presentation. Source: MOES Education and Sports Sector Fact Sheet. EMIS 2002-2016. Source: The Education and Sports Sector Annual Performance Report 2016/2017. Ministry of Education and Sports.
CRSA Stage 2: • Child Rights Context • EDUCATION Access to primary education Regional Disparities • Karamoja Female Primary NER at 33.7% (65,128 girls) • Karamoja Male Primary NER at 37.4% (84,109 boys) • Countrywide literacy rate for persons 18 years and above is 74% with improvements seen in recent years • Overall literacy rates for persons 18 years and above in Karamoja have declined in recent years from 31.6% in 2012/2013 to 26.8% in 2016/2017 • Karamoja average pupil-classroom ratio is 103.9 pupils for every 1 classroom Percentage of primary school enrolment by region in 2016/2017 Teacher Competency and Absenteeism • Teachers’ competency – 19% have the minimum acceptable knowledge on Senior 4 English and Mathematics tests • Teachers average score in pedagogical knowledge just 28% and only 7% of the tested teachers scoring 50% or higher • Based on direct school observations and interviews of Primary 2 classrooms, 46.5% of schools had a Primary 2 teacher who had not attended any in-service training within the last 2 years • Average teacher absentee rate is 23.8% • Average pupil absentee rate is 52.5% Source: 2016/2017 Uganda National Household Survey (UNHS). Uganda Bureau of Statistic (UBOS). Final Presentation. Source: The Education and Sports Sector Annual Performance Report 2016/2017. Ministry of Education and Sports. Source: “Are Our Children Learning (2016)?”, Uwezo Uganda Sixth Learning Assessment Report. December 2016. Source: UNICEF Country Programme Action Plan (2016 – 2020). 2015. Source and Image: 2016/2017 Uganda National Household Survey (UNHS). Uganda Bureau of Statistic (UBOS). Final Presentation.
CRSA Stage 2: • Child Rights Context • EDUCATION Survival through primary education system • Overall approximately 7% of pupils ages 6 to 13 are out of school • 16% of non-enrolment or dropout cases are children with physical and/or mental disabilities • A SCI Qualitative Joint Needs Assessment revealed the following top reasons for children never enrolling/dropping out of school: • Cannot afford uniform and/or other materials • Distance to nearest school is too far • Inadequate infrastructure • Needing to do work/chores • Married/pregnant/have small children • In 2016, only 19.6% completed Primary 7 • Of those that completed and sat for Primary Leaving Examination, 86.9% passed • The reported repetition rate is 8.3%, however, this is likely to be much higher as recent research in Primary 1 indicates Source: The Education and Sports Sector Annual Performance Report 2016/2017. Ministry of Education and Sports. Source: MOES Education and Sports Sector Fact Sheet. EMIS 2002-2016. Source: “Uganda Early Years Enrolment and Repetition: Milestone 2 Draft Report.” DFID East Africa Research Hub. RTI International. January 2018. Source and Image: “Are Our Children Learning?. Five Stories on the State of Education in Uganda in 2015 and Beyond. Fifth Uwezo Annual Learning Assessment. Source: “Are Our Children Learning (2016)?. Uwezo Uganda Sixth Learning Assessment Report. December 2016. Source: “Out of School Children Study in Uganda.” March 2014. Source: Joint Education Needs Assessment Report. Save the Children Uganda. December 2017.
CRSA Stage 2: • Child Rights Context • EDUCATION Access to education and resources for refugee children in Uganda F: 146,9191 M: 151,160 Source and Images: Uganda Refugee Response Monitoring Sector Fact Sheet: Education. UNHCR. January 2018.
CRSA Stage 2: • Child Rights Context • EDUCATION Enrolment in Secondary schools Access to post-primary technical/vocational education (BTVET) Percentage of secondary school age children attending secondary school Source: MOES Education and Sports Sector Fact Sheet. EMIS 2002-2016. Source and Image: 2016/2017 Uganda National Household Survey (UNHS). Uganda Bureau of Statistic (UBOS). Final Presentation.
CRSA Stage 2: • Child Rights Context • EDUCATION • In Uganda, children ages 0 – 4 years constitute 17.7% of the entire population • In Uganda, children ages 5 – 14 years constitute 30.2% of the entire population Source and Image: “Are Our Children Learning (2016)?. Uwezo Uganda Sixth Learning Assessment Report. December 2016.
CRSA Stage 2: • Child Rights Context • CHILD POVERTY Low Household Income Poverty according to national definitions Percentage of the population living on less than $1.90 a day at 2011 international prices. Poverty headcount ratio at $1.90 a day (2011 PPP) (% of population) Please choose an indicator from the PDF file to visualise here. 27 % live on < $1.90 Source: UNHS (UBOS, 2016/17)
CRSA Stage 2: • Child Rights Context • CHILD PROTECTION Child marriage Child Labour Percentage of women who were married before age 15 or18 years Percentage of child marriage per region. . -Overall, a minimum of 2,048,000 (14 percent) of the children aged 5-17 years were in child labour. -About 2.4 million children are engaged in exploitative child labour, of which 1.7 million are below 14 years of age (MoGLSD, 2012a). -The proportion is higher among 5–11-year-olds, where 36% of boys and 32% of girls are working. -There are also regional and spatial differences; in the relatively deprived Karamoja region, a quarter of working children are engaged in hazardous forms of labour (MoGLSD, 2012a). -Conflict in the North has also had an enormous impact on children’sSource: UnicefSitan2015. DHS 2016/17. - Child Marriage, Early Childbearing and Educational Attainment for Girls(15-18 years) is highest for girls in lowest wealth quintile child marriage at 54.4% and primary completion rate at 11.6%. DHS 2016/17
CRSA Stage 2: • Child Rights Context • CHILD PROTECTION Child marriage. Marital Status of girls currently aged 15-19 years. Greater Eastern region has the highest proportion of girls(15-19 years) who have started at an average of 26.5% -30.65%, while southwest has the lowest 14.6%. Please add here other national data produced that may be relevant (and not included in the Global Result Framework indicators) produced by your country that may be relevant. • Karamoja region has the lowest number of girls(15-19 years) who have started child bearing at 20,163, while East central and western region have the highest number at 59,701 and 53,438
CRSA Stage 2: • Child Rights Context • CHILD POVERTY Low household income Poverty according to national definitions Percentage of the population living on less than $1.90 a day at 2011 international prices. Child poverty regional distribution in Uganda Please choose an indicator from the PDF file to visualise here. 60% Ugandans are below 18 years of age, Child poverty is more prevalent in the greater North and Eastern region. 25% - 95% of children in this regions are poor or vulnerable to poverty EPRC, 2013 Source: UNHS (UBOS, 2016/17)
CRSA Stage 2: • Child Rights Context • CHILD POVERTY Food Insecurity according to national definitions Families and households are food insecure Dietary Energy Consumption. Prevalence of moderate or severe food insecurity in the population, based on the Food Insecurity Experience Scale (FIES) Uganda’s Mean Dietary Energy Consumption (DEC) 1,464 kcal/person/day (below recommended 2100Kcal/person/day) • Female headed hhs - 1,509 kcal/person/day • Male headed hhs – 1448 kcal/person/day Sub-regional • West Nile highest DEC - 1,755 kcal/person/day • Ankole DEC - 1,752 kcal/person/day, • Teso DEC - 1,717 kcal/person/day • Tooro DEC - 1,670 kcal/person/day • Busoga DEC - 1,215 kcal/person/day • Bugishu DEC - 1,051 kcal/person/day Source: UNHS (UBOS, 2016/17)
CRSA Stage 2: • Child Rights Context • CHILD POVERTY Employment eligibility Employment Act (2006). 14 + years; Children Act (2016) 16 + years Unemployment Proportion of youth aged 15-24 not in education, employment or training The unemployment rate is the proportion of the labour force (working and unemployed, aged14-64) that is unemployed. National unemployment rate is 9.2% Youth unemployment rate is 6.5% However, • Agriculture sector 57% in 2015 • Services sector 32%; females (33%) males (31 percent). • Industry sector 11% males (16%) females (6%) Source: UNHS (UBOS, 2016/17)
CRSA Stage 2: • Child Rights Context • CHILD POVERTY Unemployment according to national definitions Youth unemployment Proportion of youth aged 15-24 not in education, employment or training The unemployment rate is the proportion of the labour force (working and unemployed, aged14-64) that is unemployed. • 68% young people out of school had only P7 education • 3.4% completed tertiary education. • 51% leave school early (59% female) • 71% young people under-educated for skilled agriculture, forestry and fishery work, plant and machine operators, and assemblers and craft and related trades work. • 64% Ugandans aged 15-29 working in 2015 • 43% self-employed, • 28% family workers • These are considered as vulnerable employment, accounting for 71% of youth. • 6.5% young people unemployed, • More educated and the women are unemployed (UBOS, 2016). Source: UBOS, 2016 Labour market transition of young people in Uganda Highlights of the School-to-Work Transition Survey 2015
CRSA Stage 2: • Child Rights Context • CHILD POVERTY Multiple deprivation according to national definitions Multiple deprivation Systemic issues that perpetuate poverty and vulnerability Enforced lack of socially perceived necessities for children and infringement of children’s most basic rights in (UNCRC). • Child’s right to health, three meals per child per day challenging. • Karamoja and Acholi land, face inability to provide 3 meals per day for children. • 4 in 5 children in West Nile deprived of their right to health. • National average 1 in 4 not afford visit to health facility or purchase medication for ill children. • Education and development, except for Central region inability to afford • school fees; • school aged children to access a desk and chair to do homework, and • age appropriate books, educational toys or games. Source: UNHS (UBOS, 2016/17)
CRSA Stage 2: • Child Rights Context • GENDER Female Genital Mutilation Gender Inequality Index A composite measure reflecting inequality in achievement between women and men in three dimensions: reproductive health, empowerment and the labour market. Percentage of girls and women who have experienced FGM by age. • Data source is UNDP Human Development Index-HDI 2016
CRSA Stage 2: • Child Rights Context • CHILD RIGHTS GOVERNANCE Government Effectiveness Government Effectiveness Compliance with UNCRC & Other Monitoring and Reporting Instruments Compliance with UNCRC & Other Monitoring and Reporting Instruments • Uganda has reviewed, amended and enacted several legal instruments, e.g The ChildrenActAmended in 2016. • 7 Action plans developed between 2015 - 2017 • Concluding Observations and Recommendations on Uganda’s State Party Report on the UN Convention on the Rights of Persons with Disabilities Disseminated • UPR report on Uganda adopted in 2017 through a collaborative process involving the Government of Uganda Source; UNICEF, Ministry of Gender, Labour and Social Development (201 5- 2017) Source: Uganda Human Rights Commission, 2016; http://uhrc.ug/concluding-observations-and-recommendations-crpd Source: CIVICUS, 2017
CRSA Stage 2: • Child Rights Context • CHILD RIGHTS GOVERNANCE Government Effectiveness Compliance with UNCRC & Other Monitoring and Reporting Instruments . • Uganda ratified various human rights instruments that monitor implementation of core human rights treaties. This obligates the country to submit periodic State Party Reports. However, submission of various reports are overdue as highlighted in the table below. Source: African Peer Review Mechanism; Uganda Country Self Assessment Report, May 2017
CRSA Stage 2: • Child Rights Context • CHILD RIGHTS GOVERNANCE Extent to which civil society is able to operate without hindrance . Capability of CSOs and Children to engage around Children’s Rights • Over 80 CSO collective advocacy, monitoring, reporting and other related engagements to facilitate development of laws and policies; to develop and disseminate child rights monitoring reports as well as several child rights related programming undertakings conducted since 2015 • I child specific report on the UNCRC captioned ‘’Voices of Ugandan Children on the Status of enjoyment of their Rights’’ developed • The National Child Protection Working Group that brings together child focused Government, CSO and Development partners nurtured and facilitated systematic consultations geared towards enhancing the development and implementation of child friendly polices, laws and budgets Source; National Child Protection Working Group, Uganda Child Rights NGO Network, Save the Children and Uganda Debt Network (2015 – 2018) • Restrictive legislation on CSO operations and increased restriction of peaceful assemblies, including use of excessive force to break up protests. Source: CIVICUS and Foundation for Human Rights Initiative, February 2017
CRSA Stage 2: • Child Rights Context • CHILD RIGHTS GOVERNANCE Efficient Budget Allocation Proportion of Public Resources Spent on Essential Services Targeting Children . Source; Budget Framework Paper 2018/19 Allocation have remained the same or reduced for child centric sectors; education, health, JLOS and Social Development. The Social Development Budget takes 14th position (one of the lowest) in the national resource envelop yet the sector caters for needs of different demographic group s- children, women, PWDs & the elderly.
CRSA Stage 2: • Child Rights Context • GENDER Percentage of women and men aged 15-39 years who have ever experienced sexual violence Sexual Violence Percentage of women aged 15-49 years who have experienced sexual violence at one point in their lives. • Data source is UNDP Human Development Index-HDI 2016
CRSA Stage 2: • Child Rights Context DISABILITY Qualitative Reports National quantitative data Percentage of Children with Disability in Uganda per impairment. Country profile on Disability. • Thechilddisabilityprevalenceisapproximately13%,orabout2.5millionchildrenlivewithsomeformof disabilityinUganda. • About 9%ofboysandgirlsofschoolgoingagewithdisabilitiesattendprimaryschoolandonly6%ofthem continuestudyinginsecondaryschool. • UgandaratifiedtheconventionontheRightsofthechild(CRc)in1990. • UgandaratifiedtheconventionontheRightsofpersonswithdisabilities(CRPd)in2008 Unicef. CWD Situation Analysis.2014 Source: AfricanChildPolicyForum(ACPF),childrenwith disabilitiesinUganda: ThehiddenReality.2011,p.22
CRSA Stage 2: • Child Rights Context • URBANISATION Population living in urban centres Urbanisation Country profile on Urbanisation Proportion of population living in urban centres for top 20 urban centres in Uganda.1991-2014 • In March 2016, there were 259 urban centres in Uganda. These include one Capital City, 33 Municipalities, 163 Town Councils and 62 Town Boards. • The urban population has been increasing overtime from about 1.7 million in 1991 to nearly 7.4 million in 2014. • The Population of all urban Centres is 7,425,864 with 27 urban Centres having a population of more than 50,000 persons NationalPopulationandHousing Census.2014
CRSA Stage 2: • Child Rights Context • MIGRATION Migration by main reason Household migration Percentage of household members who have migrated by direction of movement across the country in the last 5 years. Percentage of household members who have migrated to other areas for different reason over the last 5 years..
Demographic Statistics Children 0-17 61% 18-5937% 60+ 2% FemaleMale • CRSA Stage 2: • Child Rights Context • MIGRATION Child Refugees and asylum seekers. Percentage of child refugees and asylum seekers in country of asylum. REFUGEES AND ASYLUM SEEKERS Percentage of refugees and asylum seekers by gender and age group in country of asylum. . 54% 46% 51% 49% SSD: 1,411,794 DRC: 251,730 51% 49% 50% 50% Source: Registration Unit, UNHCR RO Kampala - March, 2018
Outbreaks 1,600 Cholera cases Refugee Children GAM rate 3%-11.8% Urban refugees 1.2% • CRSA Stage 2: • Child Rights Context • MIGRATION Percentage of child refugees and asylum seekers Health figures REFUGEES AND ASYLUM SEEKERS Percentage of refugees and asylum seekers in Settlements and Urban Refugees . Source: Registration Unit, UNHCR RO Kampala - March, 2018
CRSA Stage 2: • Child Rights Context • RESILIENCE Risk from natural hazards (II)-Economic Losses. Risk from natural hazards (1)-Mortality Qualitative Reports & National statistics • Losses due to floods are the most frequent (51.4%) followed by drought (17.1%) and landslides (11. 4%) according to INFROM results report 2018. Foods are common in Western and West Nile whereas landslides are common in the Eastern, and western parts of Uganda (Global risk data platform, 2018) • Multi-hazard average annual losses is equivalent to $ 42.74 Million (INFORM, 2018) • Less than 2% of the agricultural households use irrigation (UNHS, 2017) • Poverty rates at 19.7% (especially in Northern and Eastern Uganda) – Uganda Poverty assessment report 2016. • 40% of the poorest households are exceptionally vulnerable to drought and price shocks (Hill and Mejia-Mantilla 2017) • Adolescent child bearing at 27% in rural communities (Uganda demographic and health survey, 2016) • Long-lasting and recurrent conflicts have altered the grazing patterns of affected communities in Uganda, reducing both their resilience and their coping strategies (UNICEF, 2017 – State of food security and nutrition in the world) • Rapid population growth - About half (48.7 percent) of Uganda’s population is younger than 15 years. (Uganda poverty assessment report 2017) • Limited government support available to households to manage shocks (35% of households rely on personal savings whereas 25% rely on family support to mitigate the impact of weather and climate risks (Uganda Poverty assessment report, 2016)
CRSA Stage 2: • Child Rights Context • RESILIENCE Risk from Natural Hazards – Country risk dimensions and components • *Country Risk Index; 0 to 10 = 6.0 (INFORM Country Risk Profiles, 2018)
RESILIENCE Risk from Natural Hazards – Hazard Exposure Maps (Floods, Landslides and drought) Source: UNISDR 2013, Global risk data platforms. a) Flood risk areas b) Land slides risk areas * Please note that drought affects most of the regions in Uganda
CRSA Stage 2: • Child Rights Context • RESILIENCE Hazard, vulnerability and capacity trends (INFORM Country Risk Profiles, 2018)