Download
1 / 22
220 likes | 307 Views
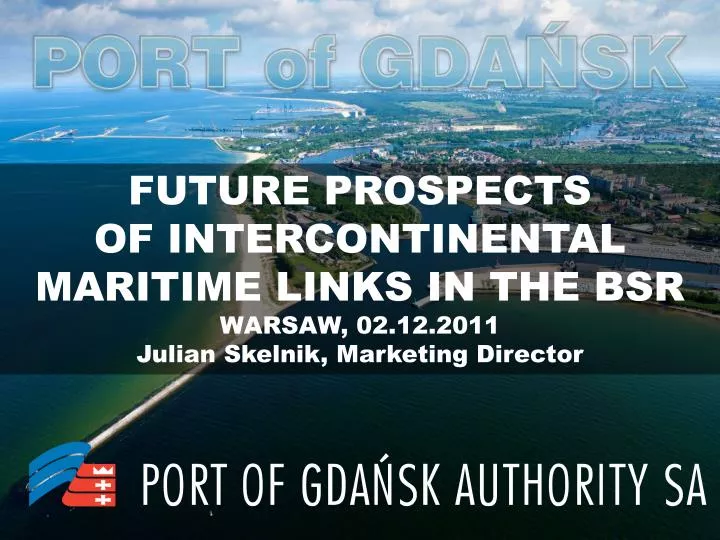
FUTURE PROSPECTS OF INTERCONTINENTAL MARITIME LINKS IN THE BSR WARSAW, 02.12.2011 Julian Skelnik, Marketing Director. Gdansk is a remarkable city owing to its over 1000-year's history, Hanseatic tradition and outstanding architectural heritage.

E N D
FUTURE PROSPECTSOF INTERCONTINENTAL MARITIME LINKS IN THE BSRWARSAW, 02.12.2011 Julian Skelnik, Marketing Director
Gdansk is a remarkable city owing to its over 1000-year's history, Hanseatic tradition and outstanding architectural heritage. Johann Carl Schultz (1801-1873),Long Embankment in Gdansk, 1837
OUTER PORT INNER PORT The quays leased and operated by Port of Gdansk Cargo Logistics SA 1. General cargo (FreeZone) 2. General cargo (FreeZone) 3. Ferry terminal 4. General cargo, grain 5. Grain 6. Universal quay 7. Container terminal 8. Scrap 9. Grain 10. Bulk cargo 11. Bulk cargo 12. Universal quay 13. Universal quay 14. Universal quay 15. Bulk cargo 16. Ferry terminal 17. Liquid fuel terminal 18. Coal terminal 19. LPG terminal 20. Universal pier 21. Container terminal
PORT OF GDANSK Total throughput in 2010: 27.2 million tonnes Value of cargo handled: EUR 25 billion photo: Maciej Nicgorski, City Hall of Gdansk
THROUGHPUT OF POLISH PORTSYEARS 2006-2010 thou. tonnes
CARGO HANDLING STRUCTURE IN 2010 Total volume of 27.2 million tonnes
BALTIC SEA TRANSPORT Year World Sea Transport Baltic Sea Transport (mio tons) (mio tons) (%) 1960 1 080 110 10,2 1989 3 891 300 7,7 2000 5 872 400 6,8 2009 7 843 773 9,9 2010 834
CONTAINER TURNOVER PER CAPITA IN SEAPORTS
EU FUNDS IN IMPLEMENTED PROJECTS incl. European Regional Development Fund, European Social Fund and Coherence Fund years 2007-2013 milliard Euro based on report by the European Commission, March 2010
SUCHARSKIROUTE TUNNEL
The Baltic Region • 100 million consumers • Hundreds of thousands of companies • Expanding markets • Growing demand • Increased freight volumes • Changing cargo flows • Focus on intermodal solutions
Total turnover of the Baltic seaports [million tonnes] source: Gdynia Maritime University, Baltic Transport Journal
Maritime transport of freight – national structure of the Baltic seaports in 2010
TOP 10 BALTIC SEAPORTS IN 2010 thou. tonnes
TOP 10 BALTIC CONTAINER SEAPORTSIN 2010 thou. TEU
CONTAINERSIN THE PORT OF GDANSK FORECAST
SEAPORTS CONNECTED WITH ASIA BY MAERSK SERVICES GOTHENBURG AARHUS BREMERHAVEN GDANSK FELIXSTOWE HAMBURG SOUTHAMPTON ROTTERDAM ZEEBRUGGE ANTWERP LE HAVRE TRIESTE KOPER CONSTANTA GENOA RIJEKA LA SPEZIA BARCELONA VALENCIA GIOIA TAURO ALGECIRAS
FEEDER CONTAINER SERVICES RAUMA KOTKA ST. PETERSBURG HELSINKI GÄVLE STOCKHOLM GOTHENBURG AARHUS HELSINGBORG COPENHAGEN PORT OF GDANSK HAMBURG BREMERHAVEN ROTTERDAM ANTWERP BRZEG DOLNY SLAWKOW GLIWICE
Sulphur regulations for Marine Fuel • Global sulphur limits (including EU countries not in the SECA) • 4.5% ismaximumtoday • 3.5% from 2012 • 0.5% globally from 2020 if feasible otherwise from 2025 • Sulphur limits in SECA (Sulphur Emission Control Area), • which is within the English Channel, North Sea and Baltic Sea: • 1.0% is maximum today (from July 2010) • 0.1% from 2015 Geographical area of the IMO sulphur regulation The Sulphur Emission Control Area (SECA) Countries with water only in SECA Countries with part of the coast in SECA Countries without coast in SECA Has not signed the Marpol convention
Negative consequences of IMO SOx regulations • Cost increase of marine fuel by 45-80% – average 75% • Sea transport cost increase with 30-50% • Cost increase in the range of 2-9€/tonne product • Modal back-shift ca. 30% to road and rail – increased CO2 emissions • Changed logistics flow in Europe in order to avoid the SECA