Download
1 / 5
60 likes | 76 Views
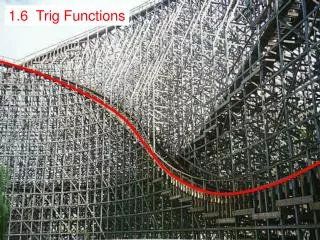
1.6 Modeling Real-World Data with Linear Functions. Objectives: Draw and analyze scatterplots, write a prediction equation and draw best-fit lines, use a graphing calculator to compute correlation coefficients to determine goodness of fit, and solve problems using prediction equation models.

E N D
1.6 Modeling Real-World Data with Linear Functions Objectives: Draw and analyze scatterplots, write a prediction equation and draw best-fit lines, use a graphing calculator to compute correlation coefficients to determine goodness of fit, and solve problems using prediction equation models.
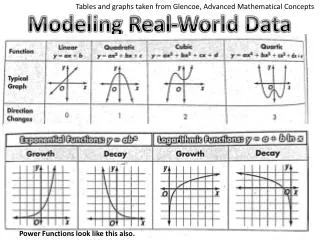
A visual representation of data Scatterplot: Prediction Equation: An equation suggested by the points of a scatterplot used to predict other points. Best-fit-line: The graph of a prediction equation. See page 38
The table summarizes the total U.S. personal income from the years 1986 to 1997. Predict personal income in the year 2001 Ex. 1) Personal Income
The degree to which data fits a regression line. Goodness to fit: Correlation Coefficient: A value that describes the nature of a set of data. The more closely the data fit a line, the closer the correlation coefficient, r, approaches 1 or -1. See pg. 40 Regression Line: A best-fit line
The table contains the carbohydrate and calorie content of 8 foods, ranked according to carbohydrate content. Ex. 2) a.) Find an equation with a calculator b.) Predict the number of calories in a food with 75.9 grams of carbohydrates.