Download
1 / 40
400 likes | 935 Views
Water Pollution. Chapter 22 APES Ms. Miller. Key Concepts. Types, sources, and effects of water pollutants. Major pollution problems of surface water. Major pollution problems of groundwater. Reduction and prevention of water pollution. Drinking water quality.

E N D
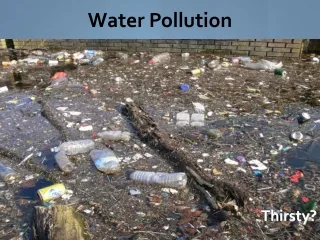
Water Pollution Chapter 22 APES Ms. Miller
Key Concepts • Types, sources, and effects of water pollutants • Major pollution problems of surface water • Major pollution problems of groundwater • Reduction and prevention of water pollution • Drinking water quality
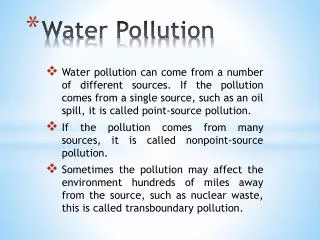
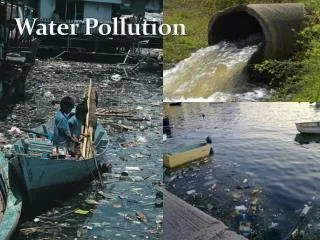
Types and Sources of Water Pollution • Point sources
Biological oxygen demand Biochemical oxygen demand is a measure of the quantity of oxygen used by microorganisms (e.g., aerobic bacteria) in the oxidation of organic matter. Natural sources of organic matter include plant decay and leaf fall.
Water quality Water Quality Do (ppm) at 20˚C Good 8-9 Slightly polluted 6.7-8 Moderately polluted 4.5-6.7 Heavily polluted Below 4.5 Gravely polluted Below 4 Fig. 19.2, p. 478
Pollution of Streams Clean Zone Decomposition Zone Septic Zone Recovery Zone Clean Zone Normal clean water organisms (Trout, perch, bass, mayfly, stonefly) Trash fish (carp, gar, Leeches) Fish absent, fungi, Sludge worms, bacteria (anaerobic) Trash fish (carp, gar, Leeches) Normal clean water organisms (Trout, perch, bass, mayfly, stonefly) Types of organisms 8 ppm 8 ppm Dissolved oxygen Oxygen sag Concentration Biological oxygen demand 2 ppm Direction of flow Point of waste or heat discharge Time of distance downstream • Oxygen sag curve • Factors influencing recovery Fig. 19.3, p. 479
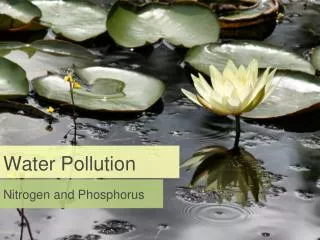
Pollution of Lakes Discharge of untreated municipal sewage (nitrates and phosphates) Nitrogen compounds produced by cars and factories Natural runoff (nitrates and phosphates Discharge of detergents ( phosphates) Manure runoff From feedlots (nitrates and Phosphates, ammonia) Discharge of treated municipal sewage (primary and secondary treatment: nitrates and phosphates) Runoff from streets, lawns, and construction lots (nitrates and phosphates) Lake ecosystem nutrient overload and breakdown of chemical cycling Runoff and erosion (from from cultivation, mining, construction, and poor land use) Dissolving of nitrogen oxides (from internal combustion engines and furnaces) • Eutrophication • Slow turnover • Thermal stratification Fig. 19.5, p. 482
Case Study: The Great Lakes CANADA Nipigon Bay Jackfish Bay Thunder Bay Silver Bay St. Mary’s R. St. Lawrence R. Spanish R. St. Louis R. MICHIGAN Penetary Bay Sturgeon Bay WISCONSIN MICHIGAN Saginaw Bay NEW YORK Niagara Falls Saginaw R. System Grand R. MINNESOTA Niagara R. St. Clair R. Thames R. Buffalo R. Detroit R. Rouge R. Raisin R. Ashtabula R. PENNSYLVANIA IOWA Cuyahoga R. Maumee R. Rocky R. Black R. ILLINOIS INDIANA OHIO Great Lakes drainage basin Most polluted areas, according to the Great Lakes Water Quality Board “Hot spots” of toxic concentrations in water and sediments Eutrophic areas Fig. 19.7, p. 484
Groundwater Pollution: Sources Waste lagoon, pond, or basin Hazardous waste injection well Mining site Water pumping well Buried gasoline and solvent tanks Pumping well Road salt Sewer Landfill Cesspoll, septic tank Leakage from faulty casing Unconfined freshwater aquifer Groundwater Confined freshwater aquifer Groundwater flow Discharge Confined aquifer • Low flow rates • Fewbacteria • Colder • Temps Fig. 19.9, p. 487
Groundwater Pollution Prevention • Monitoring aquifers
Leak detection systems Tyco Thermal Controls provided the solution with its cable-based TraceTek leak detection system using TT5000 sensing cable which contains a hydrocarbon scavenging material. Installed within PVC conduit in the soil beneath fuel tanks it offers a system capable of quickly detecting fuel leaks. Any spillage is drawn into the conduit by capillary action and contact is absorbed by the cable jacket which swells and as contact is made with the electrodes in the cable core leak detection is achieved. TraceTek systems are offered with continuous monitoring equipment for very quick detecting, precise locating and triggering alerts.
Strictly regulating hazardous waste disposal Schematic diagram of a secure hazardous-waste landfill with a double leachate collection system
Groundwater contamination occurs when man-made products such as gasoline, oil, road salts and chemicals get into the groundwater and cause it to become unsafe and unfit for human use. Some of the major sources of these products, called contaminants, are storage tanks, septic systems, hazardous waste sites, landfills, and the widespread use of road salts, fertilizers, pesticides and other chemicals.
Ocean Pollution Industry Nitrogen oxides from autos and smokestacks; toxic chemicals, and heavy metals in effluents flow into bays and estuaries. Cities Toxic metals and oil from streets and parking lots pollute waters; sewage adds nitrogen and phosphorus. Urban sprawl Bacteria and viruses from sewers and septic tanks contaminate shellfish beds and close beaches; runoff of fertilization from lawns adds nitrogen and phosphorus. Constructionsites Sediments are washed into waterways, choking fish and plants, clouding waters, and blocking sunlight. Farms Run off of pesticides, manure, and fertilizers adds toxins and excess nitrogen and phosphorus. Red tides Excess nitrogen causes explosive growth of toxic microscopic algae, poisoning fish and marine mammals. Closed shellfish beds Closed beach Oxygen-depleted zone Toxic sediments Chemicals and toxic metals contaminate shellfish beds, kill spawning fish, and accumulate in the tissues of bottom feeders. Healthy zone Clear, oxygen-rich waters promote growth of plankton and sea grasses, and support fish. Oxygen-depleted zone Sedimentation and algae overgrowth reduce sunlight, kill beneficial sea grasses, use up oxygen, and degrade habitat. Fig. 19.11, p. 489
Red Tides: Pollution caused by an overpopulation one of the following four causes which MAY cause the water to turn red, green, orange or brown and MAY toxify the water Causes: 1) diatoms 2) photosynthetic dinoflagellates 3) cyanobacterium 4) massive blooms of phytoplankton
Case Study: Chesapeake Bay Cooperstown NEW YORK PENNSYLVANIA ATLANTIC OCEAN Harrisburg NEW JERSEY MARYLAND Baltimore WEST VIRGINIA Washington DELAWARE Richmond VIRGINIA Chesapeake Bay Norfolk Drainage basin No oxygen Low concentrations of oxygen • Largest US estuary • Relatively shallow • Slow “flushing” action to Atlantic • Major problems with dissolved O2 Fig. 19.13, p. 490
The EPA raised its estimate of the nitrogen that flowed to the bay in 2008 from 258 million pounds to 283 million pounds.
Oil Spills • Sources: offshore wells, tankers, pipelines and storage tanks
Effects: death of organisms, loss of animal insulation and buoyancy, smothering
Chemical cleanup methods: coagulants and dispersing agents More than two million gallons of dispersants have been put into the Gulf waters surrounding the BP oil spill a VIMS scientist told a senate caucus July 29, 2011
Solutions: Preventing and Reducing Surface Water Pollution Nonpoint Sources Point Sources • Reduce runoff • Clean Water Act • Buffer zone vegetation • Water Quality Act • Reduce soil erosion
Technological Approach: Sewage Treatment Secondary Primary Grit chamber Chlorine disinfection tank Bar screen Settling tank Aeration tank Settling tank To river, lake, or ocean Raw sewage from sewers (kills bacteria) Sludge Activated sludge Air pump Sludge digester Sludge drying bed Disposed of in landfill or ocean or applied to cropland, pasture, or rangeland Fig. 19.15, p. 494 • Mechanical and biological treatment
Technological Approach: Septic Systems Septic tank Nonperforated pipe Manhole (for cleanout) Household wastewater Drain field Gravel or crushed stone Perforated pipe Distribution box (optional) Vent pipe • Require suitable soils and maintenance Fig. 19.14, p. 494
Technological Approach: Advanced Sewage Treatment Specialized compound removal (DDT, etc.) Effluent from Secondary treatment Alum flocculation plus sediments Desalination (electrodialysis or reverse osmosis) Activated carbon Nitrate removal 98% of suspended solids 90% of phosphates To rivers, lakes, streams, oceans, reservoirs, or industries 98% of dissolved organics Most of dissolved salts Recycled to land for irrigation and fertilization • Removes specific pollutants Fig. 19.16, p. 495
Technological Approach: Using Wetlands to Treat Sewage (1)Raw sewage drains by gravity into the first pool and flows through a long perforated PVC pipe into a bed of limestone gravel. (3) Wastewater flows through another perforated pipe into a second pool, where the same process is repeated. Sewage Treated water Wetland type plants Wetland type plants 45 centimeter layer of limestone gravel coated with decomposing bacteria First concrete pool Second concrete pool (2) Microbes in the limestone gravel break down the sewage into chemicals, that can be absorbed by the plant roots, and the gravel absorbs phosphorus. (4) Treated water flowing from the second pool is nearly free of bacteria and plant nutrients. Treated water can be recycled for irrigation and flushing toilets. Fig. 19.17, p. 497
Drinking Water Quality Contaminated Probability 10 to 20 percent Greater than 20 percent Not tested • Bottled water • Safe Drinking Water Act • Maximum contaminant levels Fig. 19.10, p. 488