Download
1 / 20
200 likes | 313 Views
Child Outcomes Measurement Tools & Process. A story of 3 conversions. Conversion #1: COSF. Meet federal reporting requirements Uses information that IFSP/IEP teams already have Allows for the use of different tools to measure status at entry and exit.

E N D
Child Outcomes Measurement Tools & Process A story of 3 conversions
Meet federal reporting requirements Uses information that IFSP/IEP teams already have Allows for the use of different tools to measure status at entry and exit The COSF is NOT an Assessment Instrument
Age-Expected Skills Immediate Foundational Foundational Predicted Developmental Progression Foundational Foundational Foundational
COSF’s 7 point scale 1 2 3 4 5 6 7
Understanding The COSF’s 7-Point Scale Ratings of 6 or 7 represent age-expected or age-appropriate functioning with each lower point being progressively more distant from age expectations.
The “B” Question to be answered at Exit Has the child shown any new skills or behaviors related to this outcome since the child’s last outcomes summary?
Local Reporting Timeline COSF at Entrance To Part C COSF at Exit from Part C and/or Entrance To Part B COSF at final progress reporting opportunity prior to kindergarten Entry into Part C Exit C--Enter B Transition to K For any child served 6 months or more under Part C and 6 months or more under Part B
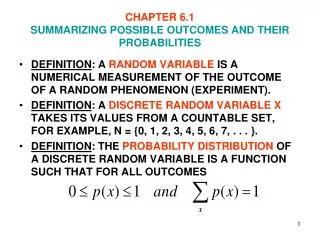
Conversion #2: OSEP Progress Categories • The OSEP categories describe the types of progress a child can make between entry and exit. • Two COSF ratings (entry and exit) are needed to determine which OSEP category describes a child’s progress
Functioning 13
Entry 14
Entry Exit 15
Entry Exit 16
Conversion #2: OSEP Progress Categories • Did not improve functioning. • Improvement but not closer to age level. • Improvement and closer to age level. • Improvement to age level. • Maintained functioning at age level.
Conversion #3: Summary Statements Summary Statement #1. Of those children who entered or exited the program below age expectations in the Outcome Area, the percent who substantially increased their rate of growth. Percent = ____(c) + (d)_____ X 100 (a) + (b) + (c) + (d)
Summary Statement 2 The percent of children functioning within age expectations in the Outcome Area by the time they exit the program. Percent = ____(d) + (e)_____ X 100 (a)+(b)+(c)+(d)+(e)
Eyes on the Prize: High quality state and local data on outcomes for children and families • Improved Programs • Improved Outcomes