Download
1 / 14
140 likes | 157 Views
Explore the demand functions, utility, and pricing dynamics in a two-period model for non-renewable resources. Analyze market structures like perfect competition and monopoly to determine optimal pricing strategies. Understand the impact of interest rate changes on resource prices and scenarios of backstop price falls. Investigate price paths with stock changes and new discoveries in the non-renewable resource market.

E N D
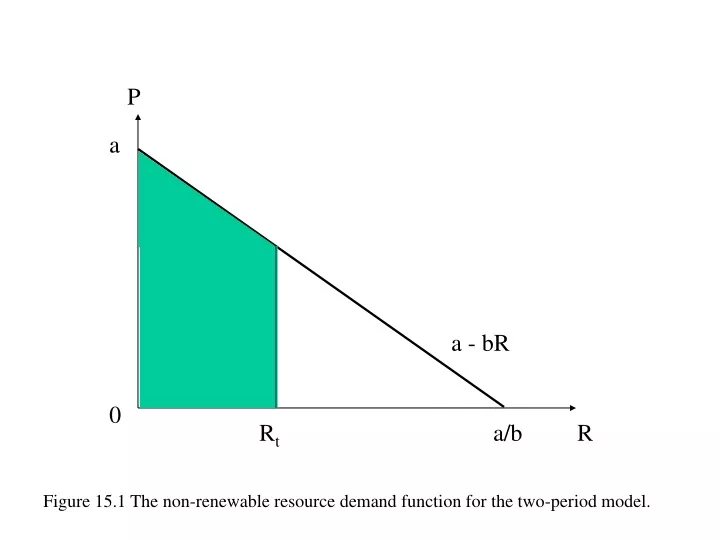
P a a - bR 0 Rt a/b R Figure 15.1 The non-renewable resource demand function for the two-period model.
P K U(R) = shaded area Ke-aR 0 R Quantity of resource extracted, R Figure 15.2 A resource demand curve, and the total utility from consuming a particular quantity of the resource.
Figure 15.3 Net price Pt PT =K Demand P0 Pt T 45° R0 R Time t Rt Area = = total resource stock T Time t
Figure 15.4 Net price Pt Perfect competition PT = PTM = K Demand Monopoly P0M P0 T TM R0M R R0 Time t T Area = TM 45° Time t
P A C B K P0 Time T Figure 15.5 The effect of an increase in the interest rate on the optimal price of the non-renewable resource.
Figure 15.6 Net price Pt K Demand P0 P0/ T/ T R0 R R0/ Time t T/ T 45° Time t
Figure 15.7 Net price Pt K Demand P0 P0/ T T/ R0 R R0/ Time t T T/ 45° Time t
Figure 15.8 Net price path with no change in stocks Pt Net price path with frequent new discoveries t
Figure 15.9 Net price Pt K P0/ D/ P0 D T/ T R0 R R0/ Time t T/ T 45° Time t
Figure 15.10 (a) Net price Pt K Backstop price fall PB P0 P0/ D R* T/ T R0 R R0/ Time t T/ T 45° Time t
Figure 15.10 (b) Net price Pt K Backstop price fall PB P0 P0/ D R* T/ T R0 R R0/ Time t T/ T 45° Time t
Resource price K Original net price New gross price Original gross price New net price cL cH T Figure 15.11(a) Time
Resource price Original gross price K Original net price New gross price New net price T/ T Figure 15.11(b) Time
Figure 15.12 Net price Pt Original gross price path K New gross price path P0/ P0 T T/ R0 R R0/ Time t T T/ 45° Time t