Download
1 / 27
270 likes | 286 Views
Explore how long detailed climate simulations provide realistic data to test methods and hypotheses in climate research. Learn about quasi-realistic climate models, forced and free simulations, and using consistent model output.

E N D
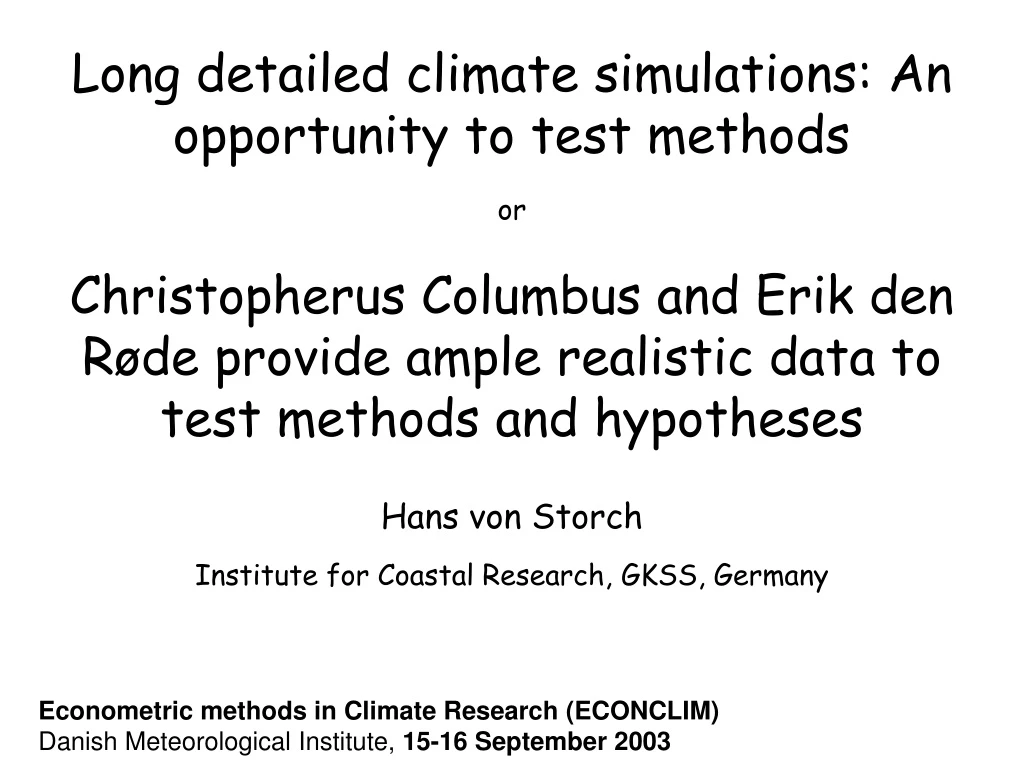
Long detailed climate simulations: An opportunity to test methodsor Christopherus Columbus and Erik den Røde provide ample realistic data to test methods and hypotheses Hans von Storch Institute for Coastal Research, GKSS, Germany Econometric methods in Climate Research (ECONCLIM) Danish Meteorological Institute, 15-16 September 2003
Overview: • Quasi-realistic climate models • Forced and free simulations: control, Christopherus Columbus and Erik den Røde • Examples of using the internally consistent model output
Institut für Küstenforschung I f K Components of the climate system. (Hasselmann, 1995)
Quasi-realistic climate models … … are dynamical models, featuring discretized equations of the type Are 20 proxies enough to reconstruct the global mean temperature? with state variables Ψkand processes Pi,k. The state variables are typically temperature of the air or the ocean, salinity and humidity, wind and current. … because of the limited resolution, the equations are not closed but must be closed by “parameterizations”, which represent educated estimates of the expected effect of non-described processes on the resolved dynamics, conditioned by the resolved state. Do temperature and precipitation proxies yield the same NAO reconstruction?
Institut für Küstenforschung I f K Dynamical processes in a global atmospheric general circulation model
Institut für Küstenforschung I f K Dynamical processes in a global ocean model
Institut für Küstenforschung I f K 1880–2049 ECHAM3/LSG 1973–1993 ERA ECMWF
Forced and free simulations: control, Christopherus Columbus and Erik den Røde
Institut für Küstenforschung I f K Free Simulation: 1000 years no solar variability, no changes in greenhouse gas concentrations, no orbital forcing Temperature (at 2m) deviations from 1000 year average [K] Zorita, 2001
List of simulations • ECHO-G f77 • Control run, 1990 conditions, 1000 year long • Forced run, 1500-1990, 12-h output “Christof Columbus” • ECHO-G f90 • Control run, 1990 conditions, 400 years long • Control run, 1850 conditions, 1000 years long • Forced run, 1000-2000 “Erik the Red” • Output: • 12 hourly, on a approximately 3ºx 3º global grid • (all standard meteorological and oceanographic variables)
Model used is ECHO-G, • a community model provided by Max Planck Institute for Meteorology, • maintained by Model & Data at MPI for Meteorology in Hamburg • The runs are made and evaluated in a consortium: • Institute for Coastal Research, GKSS • Meteorological Department, Free University Berlin • Model & Data, MPI for Meteorology, Hamburg • Department for Meteorology and Climatology, U Complutense, Madrid • and Universities in Lecce (Italy), Nanjing (China). • Comparison with historical and geological data are made together with • „KIHZ partners“ (Alfred Wegener I, Bremerhaven; Geoforschungszentrum, Potsdam; FZ Jülich, and others) • U Bern, Switzerland
Examples of using internally consistent model output • reconstructing global mean air temperature from proxy data (Zorita and co-workers) • Bimodality of extratropical atmosperic circulation? (Branstator and Berner) • Role of small scale dynamics on large-scale dynamics (J. von Storch)
NAO reconstruction (a) NAOI in the forced climate simulation, simulated by the ECHO-G model, and reconstructed from the simulated air-temperature field and the precipitation field in the North Atlantic sector over land grid points. (b) As (a) with a 50-year gaussian filter. (c) NAOI as in (b) but in the control simulation. Zorita and González-Rouco, 2002
Testing Mann‘s method for reconstructing past global mean temperature variations E. Zorita, F. González-Rouco and S. Legutke, 2003: Testing the Mann et al. (1998) Approach to Paleoclimate Reconstructions in the Context of a 1000-Yr Control Simulation with the ECHO-G Coupled Climate Model. Journal of Climate 16,1368-1390
Bimodality of large-scale atmospheric flow? Sutera and Hansen, 1986
Testing the of multimodality of large scale atmospheric dynamics Berner and Branstator, pers. comm
Role of small-scale noise on large-scale variability Ratio of T42 variability vs T21 variability J. von Storch, 2002
Four T21 AGCM simulations with added noise in components 18-21 Decorrelation function of largest scale component (0,1) Variance of inflated small scale components (n=18-21) vs. dissipation of large scale components (n6) J. von Storch, 2002
Ratio of variance in 2d wave-number space Noise vs. Control run J. von Storch, 2002
Testing empirical reconstructions methods in the simulated world Are 20 proxies enough to reconstruct the global mean temperature? Do temperature and precipitation proxies yield the same NAO reconstruction?


![An Opportunity for ________________, [City or County]](https://cdn3.slideserve.com/6232564/slide1-dt.jpg)