Download
1 / 9
90 likes | 260 Views
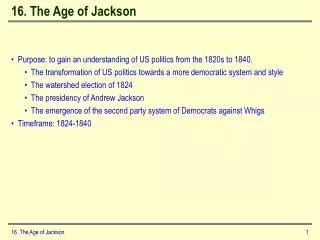
Maths Age 14-16. D4 Moving averages and cumulative frequency. D4 Moving averages and cumulative frequency. D4.1 Moving averages. A. Contents. D4.2 Plotting moving averages. A. D4.3 Cumulative frequency. A. D4.5 Box-and-whisker diagrams. D4.4 Using cumulative frequency graphs. A. A.

E N D
Maths Age 14-16 D4 Moving averages and cumulative frequency
D4 Moving averages and cumulative frequency D4.1 Moving averages • A Contents D4.2 Plotting moving averages • A D4.3 Cumulative frequency • A D4.5 Box-and-whisker diagrams D4.4 Using cumulative frequency graphs • A • A
100 90 80 70 60 50 Cumulative frequency 40 30 20 10 0 30 35 40 45 50 55 60 Time in seconds A box-and-whisker diagram A box-and-whisker diagram, or boxplot, can be used to illustrate the spread of the data in a given distribution using the highest and lowest values, the median, the lower quartile and the upper quartile. These values can be found from a cumulative frequency graph. For example, for this cumulative frequency graph showing the results of 100 people holding their breath, Minimum value = 30 Lower quartile = 42 Median = 47 Upper quartile = 51 Maximum value = 60
Minimum value Median Maximum value Lower quartile Upper quartile 30 42 47 51 60 A box-and-whisker diagram The corresponding box-and-whisker diagram is as follows:
th 378 + 1 value ≈ 2 Lap times James takes part in karting competitions and his Dad records his lap times on a spreadsheet. In 2004, 378 of James’ lap times were recorded. The track is 1108 metres long. James’ fastest time in a race was 51.8 seconds. In which position in the list would the median lap time be? There are 378 lap times and so the median lap time will be the 190th value
th 3 × th value ≈ 378 + 1 378 + 1 value ≈ 4 4 Lap times In which position in the list would the lower quartile be? There are 378 lap times and so the lower quartile will be the 95th value In which position in the list would the upper quartile be? There are 378 lap times and so the upper quartile will be the 284th value
400 350 300 250 200 Cumulative frequency 150 100 50 0 52 54 56 58 60 62 64 66 68 70 72 74 76 78 80 82 84 86 88 90 92 Lap times in seconds Lap times at Shenington karting circuit James’ lap times are displayed in the following cumulative frequency graph.
Box and whisker plot for James’ race times Minimum value Maximum value Lower quartile Median Upper quartile 52 54 58 91 53 What conclusions can you draw about James’ performance?
James’ lap times 52 54 58 91 53 Shabnum’s lap times 52 54 60 65 86 Comparing sets of data Here are box-and-whisker diagrams representing James’ lap times and Shabnum’s lap times. Who is better and why?