Download
1 / 33
330 likes | 344 Views
Explore the intercalibration process between PREI, POMI, and Valencian CS methods for evaluating pressures on Posidonia oceanica ecosystems. Learn about the benchmarking values, anthropogenic pressures impacting seagrass meadows, and the establishment of reference conditions. Discover the criteria for benchmark site selection and the relationships between methods. This study aims to enhance understanding of seagrass ecosystem health and the impact of different pressures.

E N D
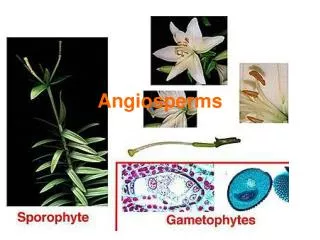
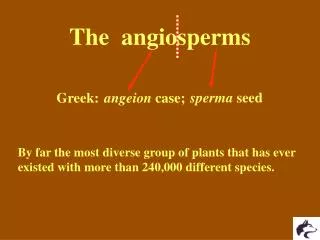
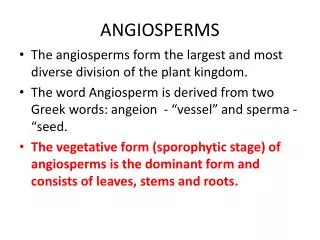
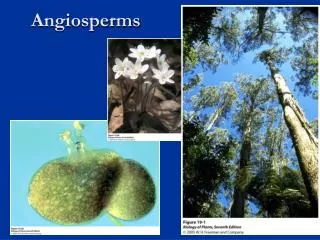
Presented by COAST coordinator W.Bonne at ECOSTAT 28 June 2011 Intercalibration Angiosperms Mediterranean Teresa Alcoverro (coordinator)
Metrics Employed • PREI (5): shoot density, shoot leaf area, epiphyte biomass/leaf biomass, depth of the lower limit, type of the lower limit • POMI (14): shoot density, cover, percent plagiotrophic rhizomes, shoot surface, necrosis, nitrogen content rhizomes, sucrose content in the rhizomes, P rhizome, N content in epiphytes, Cu, Pb, Zn in rhizomes, N15 rhizomes, S34 in rhizomes • VALENCIA CS (9): shoot density, cover, dead matter, percent of plagiotrophic rhizomes, rhizomes burial/baring, shoot surface, necrosis, herbivore pressure, leaf epiphyte biomass
Integration Method • PREI: Average of the metrics • POMI: Principal Components Analysis • Valencian CS: Principal Components Analysis
COASTAL WATERS – Mediterranean Sea GIG – Seagrasses Greece submitted justification for Cymodocea method
Participating Member States (that have provided data/information) o Spain (All regions: only data from Catalonia and Valencia for Option 2) o France (all data for Option 2) o Croatia o Cyprus o Italy o Greece (no Posidonia data) o Malta (preliminary data 1st phase, not included in analysis) (common metric 1st phase not applicable) • Intercalibration between the methods PREI (FR), CS (ES – Valencia) and POMI (ES, Catalonia) • Benchmarking with the other countries using the same method
Intercalibration of the methods • The methods: PREI, POMI and CS • Relationship between methods and pressures • Option 2: using an intercalibration common metric • Type of pressure: subtraction: Option 2_substraction • Determination of the benchmarks
How reference conditions are established • PREI: Average of the best 3 values for each metric • POMI: Average of the best 3 values for each metric • Valencian CS: Average of the best 3 values for each metric
The pressures Anthropogenic pressures that have been observed to effect Posidonia oceanica ecosystems: eutrophication, organic matter and direct effects. All different integrated pressures will consider this factors.
Relationships with the pressures: CS Pressures
Common metric: ICM The intercalibration Common Metric: ICCM based in 2 metrics: • the lower limit type of the meadows and • leaf surface area per shoot integrated following the BiPo index (Lopez y Royo et al. 2008)
Determining a benchmark We have defined benchmark sites as sites presenting very low pressures following the next criteria: • -low population density: no settlement in the next 3 km (or less than 100 habitats/ha within that area) • -mooring density lower than 2 mooring ha-1 • -no harbour or mooring facility in 3 km • -no beach regeneration within 10 km • -no trawling in the area • -no industries within the 3 km • -no fish farms • -no desalination plants • -no evidence of meadow degradation due to other unconsidered impacts
Relationship between methods and ICM: PREI EQR PREI Results extracted from IC_Opt2_subSeagrass MED.xlsx
Relationship between methods and ICM: CS EQR CS Results extracted from IC_Opt2_subSeagrass MED.xlsx
Relationship between methods and ICM: POMI EQR POMI Results extracted from IC_Opt2_subSeagrass MED.xlsx
Intercalibration process-substraction • Class boundaries of each national classification system are translated onto the ICCM, using the file IC_Opt2_subSEAGRASS MED.XLSX
Intercalibration with the rest of the countries-same method • We have done and ANOVA between benchmarks of each regions within each method
Final points • We consider this intercalibration phase to be finished for Spain, France, Italy, Cyprus, Croatia • Some countries have to do the intercalibration or use an ongoing method (Malta). • Greece has presented a new method cymo-skew that needs to be accepted by the commission. Intercalibration need to be performed in the next phase.
Final requests • Cyprus is invited to explain how they have taken into account potential differences from an island perspective (how is this reflected in the reference) • Italy is invited to explain their opinion why the PREI is similarly applicable in their territory • Amount of benchmark values is low – but it is the only group who has applied a common boundary setting procedure • Ecological characterization of G/M boundary
WG Macroalgae – CW Presentation: S. Orfanidis Coordination of group: Xavier Torras, Luisa Mangialajo (with the support of Paola Gennaro)
COASTAL WATERS – Mediterranean Sea GIG – Macroalgae and seagrasses
Validation workshop WFD: Intercalibration: Internet meeting(22 June 2011) Two Methods: CARLIT, EEI-c IC option 2: The common dataset 133 taxa (a reduced species list) 62 Sites [40 CARLIT, 22 (186 replicates) EEI-c] + 2 ideal Sites (Reference, Degrated) SPAIN: 6 Benchmarks (median EQR 0.89), GREECE: 8 Benchmarks (median EQR 0.81)
Validation workshop WFD: Intercalibration: Internet meeting(22 June 2011) Two Methods: CARLIT, EEI-c IC option 2: PCO analysis, ICM ICM COMMA (Common macroalgae) (the 1st axis of a multivariate analysis)
Validation workshop WFD: Intercalibration: Internet meeting(22 June 2011) Two Methods: CARLIT, EEI-c IC option 2: ICM-Indices relationships
Validation workshop WFD: Intercalibration: Internet meeting(22 June 2011) Two Methods: CARLIT, EEI-c IC option 2H/G and G/M boundary EQR values
Validation workshop WFD: Intercalibration: Internet meeting(22 June 2011) Two Methods: CARLIT, EEI-c IC option 2: INTERCALBRATION FINAL RESULTS (excel sheet IC_Opt2_sub v 1.24; MS_A=SPAIN, MS_B=GREECE)
Validation workshop WFD: Intercalibration: Internet meeting(22 June 2011) Two Methods: CARLIT, EEI-c IC option 2: NOT ANY ADJUSTMENT IS NEEDED! Why, any explanation?? Analysis of variance between the different benchmarks for each method (CARLIT, EEI-c) at a bilateral (Spain, Greece) scale Average and standard deviation values for the different benchmarks at each country. -The Benchmark EQR values were assessed by CARLIT (0.915) were higher than those of EEI-c (0.836) across Mediterranean Sea. -This difference may due to different sampling strategies implemented: while the sampling of CARLIT method realized during the high growth period of Cystoseira species may estimate maximum EQR values of the benchmark sites, the sampling of EEI-c method realized during whole year may estimate average EQR values of the benchmark sites.
FR ES • Pressure relationships: adjustment of pressure index IT GR