Download
1 / 39
390 likes | 512 Views
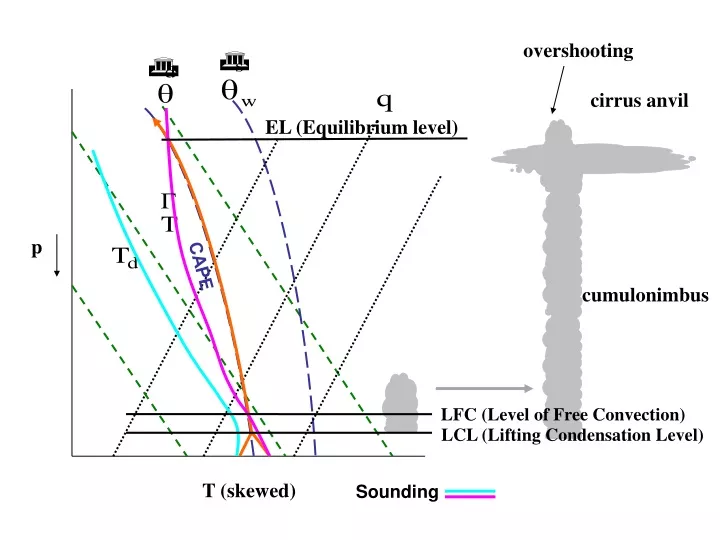
overshooting. EL (Equilibrium level). cirrus anvil. cumulonimbus. LFC (Level of Free Convection). LCL (Lifting Condensation Level). p. CAPE. T (skewed). Sounding. Mixed Condensation Level (MCL). Determine a layer which is unstable due to shear instability.

E N D
overshooting EL (Equilibrium level) cirrus anvil cumulonimbus LFC (Level of Free Convection) LCL (Lifting Condensation Level) p CAPE T (skewed) Sounding
Mixed Condensation Level (MCL) • Determine a layer which is unstable due to shear instability. • Draw a constant q line to represent the temperature sounding after mixing. • Draw a constant q line to represent the dew point temperature (or the mixing ratio) after the mixing. • The intersection of these two lines is the MCL. Ri<0.25 Criteria? Td T If top of the mixed layer C A No MCL Area A = Area B q = constant q = constant Area C = Area D B D
MCL Mixed Condensation Level (MCL) • Determine a layer which is unstable due to shear instability. • Draw a constant q line to represent the temperature sounding after mixing. • Draw a constant q line to represent the dew point temperature (or the mixing ratio) after the mixing. • The intersection of these two lines is the MCL. Td T If top of the mixed layer A C Area A = Area B q = constant q = constant Area C = Area D D B
Convective Condensation Level (CCL) The lowest level at which condensation will occur as a result of convection due to surface heating. When condensation occurs at this level, the layer between the surface and the CCL will be thoroughly mixed, the temperature lapse rate will be dry adiabatic and the mixing ratio will be approximately constant.
p . . . . . . . . . Convective Condensation Level (CCL) . . . . . . . . . . T (skewed) Convective Condensation Level (CCL) Tc Convective temperature
Stability Indices • Showalter Index • Lifted Index • K-Index • Modified K-Index • Vertical, Cross, and Total Totals indices • Severe Weather Threat • Convective Available Potential Energy • Convective Inhibition
Showalter Index (SI) • Showalter Index • Lift 850 mb parcel by appropriate processes to 500 mb and subtract its temperature from the observed 500 mb temperature. The smaller (more negative) the number the more unstable the environment. • (a measure of thunderstorm potential and severity. Especially useful when a shallow, cool layer of air below 850 mb conceals greater convective potential above)
Showalter Index (SI) T - T p 500 mb Air parcel at 500 mb Sounding at 500 mb 850 mb) T (skewed)
Showalter Index (SI) Sturtevant (1995)
Lifted Index • Lifted Index • Like the SI but the parcel is defined by mixing the lowest 100 (or 50) mb to average q and q. • (A measure of the thunderstorm potential which takes into account the low level moisture availability)
Lifted Index T - T p 500 mb Air parcel at 500 mb Sounding at 500 mb 100 mb T (skewed)
Lifted Index Sturtevant (1995)
K-Index • K-Index • Attempts to include a measure of low level moisture (Td(850mb)) and the depth of the moist layer by including the 700 mb dew points depression. Large K means a lot of moisture available to drive cumulus clouds.
K-Index Sturtevant (1995)
Modified K-Index • Modified K-Index • Replace the 850 mb T and Td with low altitude averaged values.
Vertical, Cross, and Total Totals Indices • Vertical, Cross, and Total Totals indices • Here, the larger the number is, the more unstable the atmosphere is. VT or CT >= 30 or TT > 60 indicates moderate thunderstorms with the possibility of scattered severe T-storms. • (A measurement of thunderstorm potential. Generally, the value is higher if low-level moisture extends up through the 850 mb level)
TT Sturtevant (1995)
Severe Weather Threat • Severe Weather Threat (SWEAT) • This is a complicated index involving both buoyancy and wind shear and a series of “ifs”.
Severe Weather Threat (SWEAT) Sturtevant (1995)
Convective Available Potential Energy (CAPE) • Convective Available Potential Energy (CAPE) • The amount of energy a parcel of air would have if lifted a certain distance vertically through the atmosphere. CAPE is effectively the positive buoyancy of an air parcel and is an indicator of atmospheric instability, which makes it valuable in predicting severe weather (J kg-1).
EL p LFC LCL T (skewed) Skew-T Log-P diagram
CAPE and Vertical velocity (W) • Vertical momentum equation: From hydrostatic balance and ideal gas law
CAPE and Vertical velocity (W) EL: equilibrium level Area between sounding and air parcel in the skew-T log-P diagram Theoretically, the maximum w is at . However, in reality it is below . Why? EL EL
CAPE convective cloud CAPE = 3540 J/kg
LCL CAPE Stratiform cloud NO LFC No CAPE
CAPE Sturtevant (1995)
Convective inhibition (CIN) • Convective INhibition (CIN) • A numerical measure in meteorology that indicates the amount of energy that will prevent an air parcel rising from the surface to the level of free convection. • (J kg-1).
Convective inhibition (CIN) CAPE (+) CIN (-)
Processes affecting stability • Diurnal surface temperature changes • Differential temperature or moisture advection • Differential rising or sinking motion: • stretching causes decreasing stability, compression causes increasing stability. • Others