Download
1 / 11
110 likes | 262 Views
Analysis of macroinvertebrates as indicators of biotic integrity . Hypothesis development. Environmental quality of the Poudre River Urban impact from Fort Collins Influence assessed through physical, chemical and biological characteristics. Data sampling. Environmental data

E N D
Analysis of macroinvertebratesas indicators of biotic integrity
Hypothesis development • Environmental quality of the Poudre River • Urban impact from Fort Collins • Influence assessed through physical, chemical and biological characteristics
Data sampling • Environmental data • Physical data • Watershed-scale • Urbanization, road density, etc. • Reach-scale • Stream width, slope, etc. • Chemistry data • Nitrate, conductivity, etc. • Biological data • Invertebrate metrics • Taxonomic, biotic index, species traits • Epilithon • AFDM, Chl a • Benthic organic matter • AFDM
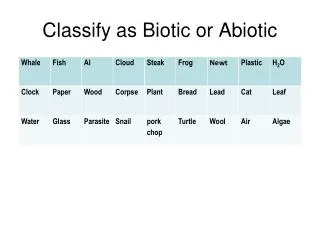
Taxonomic community structure • Richness (how many taxa) • Abundance (how many individuals per taxa) • Specific taxonomic groups • Based on knowledge of group tolerance levels • % Chironomids • % Ephemeroptera, Plecoptera and Trichoptera (EPT)
Biotic index • A score that represents the species’ tolerance to disturbance • Based on observation and expert opinion, not ecological theory Abundance Tolerance Total Chironomidae 30 × 8 = 240 5.5 Lepidostomatidae 10 × 1 = 10 = 20 × 4 = 80 Baetidae 60 330
Species traits • Traits are morphological, behavioral, ecological, or physiological characteristics of species • Traits link the environment to species distribution • Convert community metric (e.g., richness, abundance, biomass) into proportion of taxa with each trait state Rhithrogena 60% 40% Hydropsyche Baetis Rhyacophila Pteronarcys
Descriptive statistics • Central tendency • Mean or median • Variance • Standard deviation or error • Range • Minimum and maximum • Distribution • Histogram of data
Hypothesis testing • For every hypothesis, there is a null • For example • You observe that shredders eat leaf material, which is a significant portion of benthic organic matter (BOM) • Hypothesis: Shredder distribution is dependent on the quantity of BOM • Null: Shredder distribution is NOT dependent on BOM quantity • Alternative hypothesis: Small streams have more leaf litter per unit area, so shredder abundance is related to the width of streams • Null: Shredder abundance is NOT related to stream width
Null hypothesis testing • Statistics test the null hypothesis • P-value is the probability that the null hypothesis is true • Or, if the data were randomly generated, P-value is the probability that you would find the same result
ANOVA • Tests the means and variances of categorical data • Two or more samples per category required to calculate variance • T-test equivalent to ANOVA with only two categories
Regression • Tests the variances between two sets of continuous variables • May explain relationship (positive or negative) • Will test strength of relationship (R2) • Can compute P-value