Download
1 / 11
110 likes | 126 Views
A comprehensive spreadsheet for analyzing straightforward controlled trials and crossovers, including transformations, non-uniformity plots, back-transformations, reliability, and comparison of groups in pre-tests.

E N D
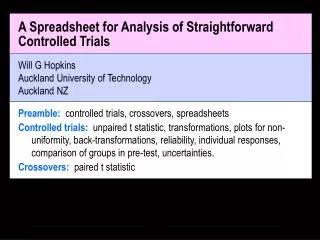
exptal Y Y control pre post1 post2 Trial C A B Treatment A Spreadsheet for Analysis of Straightforward Controlled Trials Preamble: controlled trials, crossovers, spreadsheets Controlled trials: unpaired t statistic, transformations, plots for non-uniformity, back-transformations, reliability, individual responses, comparison of groups in pre-test, uncertainties. Crossovers: paired t statistic Will G HopkinsAuckland University of TechnologyAuckland NZ
exptal Y control pre post1 post2 Trial Controlled Trials • Best design to determine effects of treatments. • Measurements at least once pre treatment and at least once during and/or post treatment. • Control and experimental groups. • Outcome statistic is difference between groups in their mean change due to the experimental and control treatments.
Y C A B Treatment Crossovers • All subjects receive all control and experimental treatments. • Aim for balance (equal number ofsubjects on each treatment order). • Aim for enough time following each treatment to allow washout. • Outcome statistic is the mean change between treatments. Spreadsheets • Instructive and save time. • OK for straightforward designs.
Features of Spreadsheet for Controlled Trials • Usual analysis of the raw values of the dependent variable. • Based on the unequal-variances unpaired t statistic. • Use for yes/no variables (score as 0 or 100) and Likert scales. • Analysis of transformed values of the dependent variable. • To reduce any systematic effect of an individual's pre-test value on the change due to the treatment. • Log transformation for most physiological and performance measures, where effects are percents or factors. • Square-root transformation for counts of injuries or events. • Arcsine-root transformation for proportions. • Percentile-rank transformation (= non-parametric analysis) when a transformation function is unclear or unspecifiable.
Another feature of Spreadsheet for Controlled Trials • Plots of change scores of raw and transformed data against pre-test values. • To check for outliers. • To confirm that the chosen transformation results in a similar magnitude of change across the range of pre-test values. • Achieve the same purpose as plots of residual vs predicted values in more powerful statistical packages. • Addresses need to avoid heteroscedasticity = non-uniformity of error = non-uniformity in the effect of the treatment. • If all pre-test values are similar, transformation is irrelevant, but… • Choose a transformation to minimize the effect of potentially wide variation in pre-test values on the effect of the treatment. • Beware of regression to the mean: lower pre-test values tend to produce more-positive changes.
More features of Spreadsheet for Controlled Trials • Various solutions to the problem of back-transformation of treatment effects into meaningful magnitudes. • Back transformation of logs into percents and factors. • Novel approach: estimate the value of the effect at a chosen value of the raw variable. (No need with log transformation.) • Cohen effects for raw analysis and all transformations. • Estimates of reliability in the control group. • Control group is a reliability study. • For comparison with reliability studies. • Typical error = (SD of change score)/2. • Change in mean. • A large change due to familiarization can account for large typical error via individual differences in familiarization.
Even more features of Spreadsheet for Controlled Trials • Estimates of individual responses to the treatment. • Expressed as a standard deviation for the mean effect. • Example: effect of the treatment is typically 3.0 ± 2.0 units (mean ± SD)… • where the SD = (diff in SD2 for change scores). • For all transformations and back transformations. • Comparison of pre-test values of means and standard deviations in the two groups. • If means differ and plots show that the pre-test value affects change scores, do an ANOVA with pre-test as a covariate. • Estimate the treatment effect at the mean value of the covariate. • Use for comparison of independent groups in a non-repeated measures study. (Ignore all the change-score stats.)
Yet another feature of Spreadsheet for Controlled Trials • Estimates of uncertainty expressed as confidence limits at any percent level (95%, 90%…) for all effects. • Including confidence limits for standard deviations representing individual responses! • A negative standard deviation implies no individual responses. • There is no adjustment of p values for multiple comparisons. • Such adjustment is a relic of hypothesis testing, but even so… • It never applied to the most important pre-planned effect. • Ignore the uncertainties for comparison of groups in the pre-test, because… • What matters is how different the groups were, not how different their corresponding populations might be. • But use the uncertainties for comparison of independent groups in non-repeated measures study .
One more feature of Spreadsheet for Controlled Trials • Chances that the true value of an effect is important • You provide a value for the effect that you consider is the smallest that would be important for your subjects. • The spreadsheet estimates the chances that the true value is greater than this smallest important value. • It also shows the chances in a qualitative form (unlikely, possible, almost certain…). • The default smallest value for the Cohen effect size is 0.2. • Try 0.6, 1.2, or 2.0 to estimate the chances that the true value is moderate, large, or very large; then state something like… • "The mean effect could be trivial or small, but it is unlikely to be moderate and is almost certainly not large." • Might help get your otherwise inconclusive study into a journal.
Features of Spreadsheet for Crossovers • Can have more than one control and experiment treatment. • Can use for a time series (= only one treatment). • Based on paired t statistic. • Uses column of zeros to pair with change scores, which… • Allows analysis of other effects from within-subject modeling. • No analysis of individual responses. • But possible with two control treatments (preferably balanced) in a crossover or two baseline treatments in a time series. • Typical error is provided for comparison with reliability study. • But may be inflated by individual responses to treatment. • Familiarization effect between trials can also inflate error, but… • Need analysis via mixed modeling to reduce this error.
Article and spreadsheets available at: See Sportscience 7, 2003 Conclusion • Can't (yet) use the spreadsheet to estimate effects of covariates such as gender and age on the treatment effects. • But the spreadsheets will work for most data and help you get more complex analyses right with a stats package.