Download
1 / 30
300 likes | 484 Views
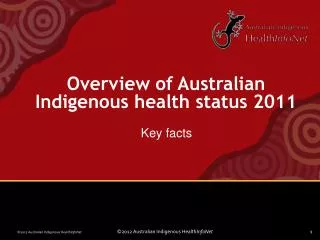
Overview of Australian Indigenous health status 2011. Tables and figures. Estimated Indigenous population, by jurisdiction, Australia, 30 June 2011. Source: ABS, 2009, ABS, 2008. Population pyramid of Indigenous and non-Indigenous populations, 2011. Source: Derived from ABS, 2009, ABS, 2011.

E N D
Overview of Australian Indigenous health status 2011 Tables and figures
Estimated Indigenous population, by jurisdiction, Australia, 30 June 2011 Source: ABS, 2009, ABS, 2008
Population pyramid of Indigenous and non-Indigenous populations, 2011 Source: Derived from ABS, 2009, ABS, 2011
Age-specific fertility rates, by Indigenous status of mother, selected jurisdictions, Australia, 2010 Source: ABS, 2011
Total fertility rates, by Indigenous status of mother, selected jurisdictions, Australia, 2010 Source: ABS, 2011
Mean birthweights and percentage of low birthweight for babies born to Indigenous and non-Indigenous mothers, selected jurisdictions, Australia, 2008 Source: Derived from Laws, Li and Sullivan, 2010
Age-standardised death rates, by Indigenous status, and Indigenous:non-Indigenous rate ratios, selected jurisdictions, Australia, 2004-2008 Source: AIHW, 2011
Expectation of life at birth in years for Indigenous people and the total population, by sex, selected jurisdictions, Australia, 2005-2007 Source: ABS, 2009
Age-specific death rates, by Indigenous status and sex, and Indigenous:non-Indigenous rate ratios, NSW, Qld, SA and the NT, 2006-2010 Source: ABS, 2011
Age-specific death rates, by Indigenous status and sex, and Indigenous:non-Indigenous rate ratios, NSW, Qld, SA and the NT, 2006-2010 Source: ABS, 2011
Infant mortality rates, by Indigenous status and sex, and Indigenous:non-Indigenous rate ratios, NSW, Qld, SA and the NT, 2008-2010 Source: Derived from ABS, 2011
Standardised death rates, by Indigenous status and cause, and Indigenous:non-Indigenous rate ratios, NSW, Qld, WA, SA and the NT, 2004-2008 Source: Steering Committee for the Review of Government Service Provision, 2011
Numbers of confinements and maternal deaths, and maternal mortality ratios, by Indigenous status, Australia, 2003-2005 Source: Derived from Sullivan, Hall, King, 2008
Age-standardised rates of avoidable deaths, by Indigenous status and jurisdiction, and Indigenous:non-Indigenous rate ratios, persons aged 0-74 years, NSW, Qld, WA, SA and the NT, 2004-2008 Source: AIHW, 2011
Numbers of hospital separations and age-standardised separation rates, by Indigenous status and jurisdiction, and Indigenous:non-Indigenous rate ratios, NSW, Vic, Qld, WA, SA and the NT, 2009-10 Source: AIHW, 2011
Age-specific hospital separation rates, by sex and Indigenous status, and Indigenous:non-Indigenous rate ratios, NSW, Vic, Qld, WA, SA and the NT, 2009-10 Source: Derived from AIHW, 2011, ABS, 2009, ABS, 2010
Numbers and proportions of hospital separations for leading causes of Indigenous separations (excluding dialysis), and Indigenous:non-Indigenous ratios, NSW, Vic, Qld, WA, SA and the NT, July 2006 – June 2008 Source: Derived from AIHW, 2011
Age-standardised incidence rates for selected cancers, by sex and Indigenous status, and Indigenous:non-Indigenous rate ratios, NSW, Vic, Qld, WA, SA and the NT, 2000-2004 Source: ABS and AIHW, 2008
Proportions of people reporting diabetes/high sugar levels as a long-term health condition, by Indigenous status, and Indigenous:non-Indigenous ratios, Australia, 2004-2005 Source: ABS, 2006
Proportions of stressors reported in the previous 12 months, by Indigenous status, year and stressor type, Australia, 2008 and 2010 Source: AIHW, 2011 and ABS, 2011
Age-standardised death rates for intentional self-harm, by Indigenous status and sex, and Indigenous:non-Indigenous rate ratios, NSW, Qld, WA, SA and the NT, 2005-2009 Source: Steering Committee for the Review of Government Service Provision, 2011
Death rates for intentional self-harm, by Indigenous status and age-group, and Indigenous:non-Indigenous rate ratios, NSW, Qld, WA, SA and the NT, 2005-2009 Source: Steering Committee for the Review of Government Service Provision, 2011
Numbers of notifications and age-standardised notification rates for end-stage renal disease, by Indigenous status, and Indigenous:non-Indigenous rate ratios, selected jurisdictions, Australia, 2007-2009 Source: Derived from ANZDATA, 2010, ABS, 2008, ABS, 2001, ABS, 2009
Numbers of notifications and notification rates of end-stage renal disease, by Indigenous status and age-group, and Indigenous:non-Indigenous rate ratios, Australia, 2007-2009 Source: Derived from ANZDATA, 2010, ABS, 2008, ABS, 2001, ABS, 2009
Age-standardised death rates for respiratory disease, Indigenous people, by sex and condition, and Indigenous:non-Indigenous rate ratios, NSW, Qld, WA, SA and the NT, 2004-2008 Source: AIHW, 2011
Proportions of people aged 18 years or older needing assistance with core activities, by Indigenous status and age-group, Australia, 2006 Source: ABS, AIHW 2008
Proportions of persons 18 years or older with profound/core activity restriction, persons, by Indigenous status and age-group, and Indigenous:non-Indigenous ratios, non-remote areas of Australia, 2008 Source: Steering Committee for the Review of Government Service Provision, 2011
Numbers of new cases and crude notification rates of tuberculosis, Indigenous people, by jurisdiction, Australia, 2003-2007 Source: Derived from Li, 2004, Roche, 2006, Roche, 2007, Roche, 2008 and Barry, 2009
Numbers of new cases and notification rates of tuberculosis, by Indigenous status and age-group, and Indigenous:non-Indigenous rate ratios, Australia, 2003-2007 Source: Derived from: Li, 2004, Roche, 2006, Roche, 2007, Roche, 2008 and Barry, 2009
Rates of drug induced deaths, persons, by Indigenous status and sex, and Indigenous:non-Indigenous rate ratios, NSW, Qld, WA, SA, and the NT, 2005-2009 Source: Steering Committee for the Review of Government Service Provision, 2011