Download
1 / 19
220 likes | 285 Views
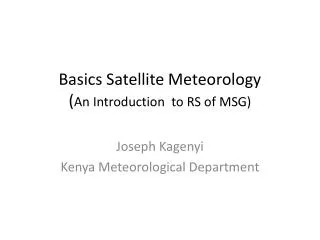
Dive into the basics of satellite meteorology with Scott Lindstrom and Hank Revercomb. Learn about black and white sensors, the Earth Radiation Budget, different orbits, spectral bands, and interpreting satellite data. Discover the world of meteorological satellite instruments and imagery.

E N D
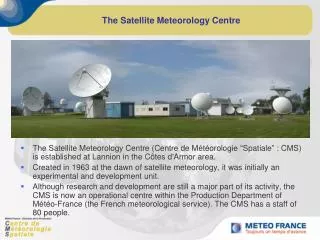
Satellite Meteorology Basics Scott Lindstrom and Hank Revercomb SSEC Tim Schmit NOAA NESDIS STAR Teachers Workshop Cape Canaveral, FL
1959—Black and White Sensors: • To address the Earth Radiation Budget challenge • Giving a global view of the Earth’s Climate • Black & White to separate Solar and IR contributions(Black = Solar + IR ; White = IR with little Solar) Inspired by 1953 thesis:“The Heat Budget over a corn field” 2
13 Oct 1959-Feb 1960 Explorer 7 measured the Earth Radiation Balance The 1st meteorological satellite instrument to observe the Earth • Radiometer designed by Verner Suomi & Robert Parent • Omni-directional spheres • 3-color (black, white, gold) Spheres also onTIROS 3, 4, 71961-63 3
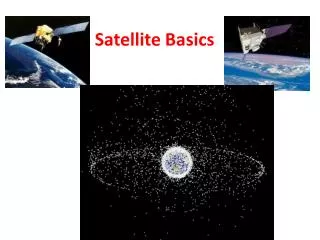
Two kinds of orbits Not to scale!
Two kinds of orbits This is one day’s worth of satellite passes (for Terra – a polar-orbiter)
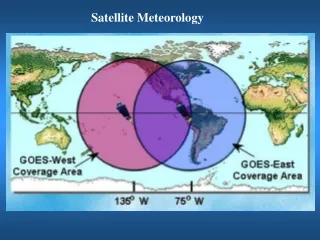
Geo (rapid refresh) vs LEO (full earth coverage)
Spectral Bands • Visible band • Cloud cover and surface features • During the day • Infrared band • Surface or cloud-top temperature • Day and Night • Water vapor band • Upper-level water vapor • Day and Night
In these images – satellite is identified, and wavelength, and day and time (UTC)
This is a Visible Image : White regions are maxima in solar reflectance This shows reflected light Albedo is highest in white regions: Clouds, Snow, Sand
This is an Infrared Image : White regions are minima in earth-emitted radiation This shows emitted energy Cold regions white; warm regions dark
Infrared In both of these images, you can detect the land-sea difference 10.7 mm Visible Conclusion: the atmosphere is mostly transparent to radiation at these wavelengths 0.63 mm
This image is from the same time – but at a different wavelength 6.7 mm…Notice that you cannot see the surface. Why?
This image is from the same time – but at a different wavelength 6.7 mm…Notice that you cannot see the surface. Why? Surface radiation at this wavelength is absorbed by the atmosphere
Satellite Data Sources • http://cimss.ssec.wisc.edu/goes/shortcourse/teachers2016.html#imagery • A variety of geostationary satellites and other info • http://www.ssec.wisc.edu/data/ • A link to a variety geostationary and polar orbiting satellites • http://ge.ssec.wisc.edu/modis-today/ • True-color MODIS Imagery over the USA, created daily • http://www.aos.wisc.edu/weather/wx_obs/Satellite.html • US- and Wisconsin-centric imagery and animations
Suomi NPP(National Polar Partnership) On 25 January2012 NASA & NOAA renamed their newest Earth-observing satellite after UW-Madison space pioneer 19 NPP VIIRS Image, GSFC