Download
1 / 64
650 likes | 665 Views
Learn about physical and physiological adaptation in swimming through changes in workload volumes, and the correlation between training volumes and performance improvements in elite swimmers. Discover how to manage daily/weekly training using tests with constant intensity and two main training strategies. Examine the rate of adaptation in different energy zones and the progression in swimming test sets. Explore factors influencing adaptation and performance improvements over a season for swimmers at all levels.

E N D
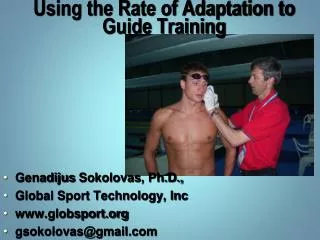
Seasonal Training Design Using the Rate of Adaptation • GenadijusSokolovas, Ph.D., • Global Sports Technology, Inc • www.globsport.org • gsokolovas@gmail.com
Adaptation • Adaptation in sport is the process of changes to workload volumes through the long-term training • It includes changes in performances, physical strength, physiological/biochemical parameters, etc.
Physical Adaptation in Swimming • General and specific muscular strength: • Strength on land (pulling on the swim bench) • Strength in the water (pulling, kicking, and swimming) • Speed on various distances: • Sprint over short distances (dives, 12.5 m, 25 m) • Sprint endurance (50 and 100 m or sets 4 x 12.5, 4 x 25, etc.)
Physical Adaptation in Swimming • General and specific endurance: • T-30 test • Long distance swimming (2,000 and 3,000 m) • Relative endurance
Physiological Adaptation • Maximum Oxygen Consumption (VO2 max) • Anaerobic/Lactate Threshold • Lactate Clearance • Blood Testing (CK, cortisol, etc.)
Adaptation to Workload Volumes • Correlation between parameters of adaptation and workload volumes in various energy zones is low. • Performance improvements have a very low correlation with changes of workload volumes in a season.
Improvements over a Season for Elite Level Swimmers • Swimming times – 0.3-2.0% • Specific Strength – 5-25% • VO2 max – 4-19% • Anaerobic Threshold – 3-7% • Time to clear lactate – 5-10% • Can these parameters be used to guide daily/weekly training?
Aerobic and Mix Volumes over a Season Meters Elite Level Swimmers Weeks
Anaerobic and Sprint Volumes over a Season Meters Elite Level Swimmers Weeks
Performance Improvements vs. Training Volumes • Performance improvements for elite level swimmers from week 1 to week 24: • Sprint performances 3-7% • Anaerobic performances 5-10% • Aerobic performances 7-12% • Training volume increase from week 1 to week 18: • Aerobic volumes 250-300% • Anaerobic volumes 200-250%
Performance vs. Training Volumes • Why performance improvements are so low in comparison with increase in training volumes and intensities? • Are there other parameters that have a higher correlation with training volumes and intensities? • Can we use other tests to manage the daily/weekly training?
Every-Day Training Parameters Speed (velocity, intensity, power etc.) Duration of work (distance, # of repetitions, etc.)
Training Strategies • Two main training strategies: • increase duration of exercise with constant exercise intensity (velocity – strategy 1) • increase training intensity (velocity – strategy 2) with constant duration of exercise
Tests with Constant Intensity in Swimming • An example of applying constant intensity strategy in swimming: • Initial test set - 4 x 100 m with :20s rest. • Athlete times - 1:10, 1:12, 1:12, 1:10. • Average time - 1:11. This is the goal (or training) time for the next time the set of n x 100 m :20s is used in practice.
Tests with Constant Intensity in Running • An example of applying constant intensity strategy in running: • Initial test set - 4 x 600 m with :60s rest. • Athlete times - 1:50, 1:51, 1:49, 1:48. • Average time - 1:50. This is the goal (or training) time for the next time the set of n x 600 m :60s is used in practice.
Tests with Constant Intensity in Other Sports • An example of applying constant intensity strategy in other sports: • Bench presses – N(4) x (6 x 10 at 80% 1RM) :90s rest. • Squats – N(4) x (4 x 10 at 85% 1RM) :90s rest. • Dummy throws – N(5) x (10 x 12 throws every 5 sec) :120s rest. • Vertical jumps – N(6) x (6 x 10 at 80% 1RM) :90s rest.
Constant Intensity – Strategy I • Constant exercise intensity (speed) • Distance of each repetition is the same • Rest interval is the same • Number of repetitions progressively increases up to 16 weeks or longer
Strategy I • In strategy I, the focus is a constant intensity (speed). • Test sets in different energy zones show the rate of adaptation for aerobic, mix, anaerobic, sprint energy systems and strength training. • This strategy is very effective for the beginning of the season (after pre-season), as the development volumes of work capacity in different energy zones which provides the base for exercise intensity.
Rate of Adaptation • Rate of Adaptation in constant intensity (speed) test sets is exponential at the beginning of the season. • It slows down significantly after 16 weeks of training. • It indicates that training with constant intensities has limitation and should not be used longer than 16-18 weeks.
Rate of Adaptation in Tests with Constant Intensity • Rate of Adaptation depends on many different factors: • Age • History of training • Level of performances • Time of the year and season • Event (sprinters vs. distance athletes) • Workload volumes in various intensity zones
Calculation the Rate of Adaptation Rep2 Day 62 Rep1 Day 20 Days Rate of Adaptation = (LN Rep2 – LN Rep1)/(Day 62 – Day 20)
Training Design Based on the Rate of Adaptation • Athlete’s condition is changing every day. • Ideally, we want to match athlete’s condition with workload volumes and intensities that would elicit the highest rate of adaptation. • How can we design a season with based on the rate of adaptation?
Training Design – Strategy 1 • When training design is based on the rate of adaptation with constant intensity (speed), we call it Strategy 1. • Progression of workload volumes in various energy zones should match with progression in tests sets with constant intensities (speeds) in the same energy categories.
Practical Application of Strategy I for Swimmers • Using of swimming sets: • n x 400 m :20-30s, n x 200 m :15-20s - aerobic energy zone • n x 100 m :15-20s, n x 50 m 1min - 1min 30s - mix aerobic-anaerobic energy zone • n x 25 m :40-60s - anaerobic energy zone • long distance swimming with constant velocity
Practical Application of Strategy I for Runners • Using of running sets: • n x 1 mile :60s, n x 800 m :45s - aerobic energy zone • n x 400 m :60s, n x 200 m on 1min 30s - mix aerobic-anaerobic energy zone • n x 100 m on 1:30 - anaerobic energy zone • long distance running with constant velocity
Sets for Swimmers • Examples of sets for sprinters: • n x 12.5 m on 60 sec • n x 25 m on 40 sec • n x 50 m on 1:30 sec • Examples for middle distance swimmers: • n x 50 on 1 min • n x 75 m :30 sec • n x 100 m :30 sec • Examples for distance swimmers: • n x 100 m :15 sec • n x 200 m :20 sec • n x 400 m :20 sec.
Sets for Runners • Examples of sets for sprinters: • n x 30 m on 1:30 • n x 50 m on 2:00 • n x 60 m on 3:00 • Examples for middle distance runners: • n x 200 on 2:00 • n x 300 m 3:00 • n x 400 m 4:00 • Examples for distance runners: • n x 400 m 2:00 • n x 800 m 4:00 • n x 1000 m 5:00
Benefits of Test Sets in Strategy I • Test sets n x … : • improve very well work capacity in prescribed energy zone • monitor of working capacity, which helps to make decision regarding adaptation of athletes to this type of workload • If progression in test sets slows down or stops, increase of workload volumes should slow down or stop as well
Training in Strategy I • Using this strategy, creates a positive change in aerobic work capacity such as: • a reduction in HR max • a faster HR in recovery • an increase in VO2 max • a lower lactate max • better lactate clearance. • It also reduces potential of overtraining and injuries because of the gradual increase in work capacity (not in the exercise intensity!) • Extensive training method versus intensive
Rate of Adaptation in Strategy I • Rate of adaptation in Strategy 1 depends on a number of parameters: • age, gender, distance orientation, duration of season, supposed workload volume, current condition, best performances in last season, and goal. • For younger athletes training in Strategy 1 should be shorter because of faster adaptation, quicker recovery, more seasons a year, and fun to compete.
Strategy II (Competition Phase) • Constant number of repetition in training sets • Distance of each repetition is the same • Exercise intensity (speed) progressively increases • Rest interval can be longer to stimulate exercise intensity • Reduce of workload volumes in all energy zones • Exercise intensity (speed) increases up to 6-7 weeks
Strategy II (Competition Phase) • For Strategy II, the focus is to have the same number of repetitions in a set; however, athletes try to increase their exercise intensity (speed) in the set. • Depending on the set and number of repetitions, athletes can train in all energy zones. • This strategy is very effective for the second part of season and taper as it utilizes the accumulated volume of working capacity during strategy I to the exercise intensity (speed).
Strategy II (Examples from Swimming) • For example, athletes could swim a set of 6 x 12.5 m in zone SP3 (sprint, creatine phosphate), or a set of 4 x 200 m in zone EN2 (mix aerobic-anaerobic). • In this training strategy, work capacity (or swimming speed in set) increases for a period of 6-7 weeks. • As the velocity doesn’t increase, or increases very slowly, using of Strategy II is no longer effective.
Strategy II (Competition Phase) • Using Strategy II, there are following changes in anaerobic work capacity such as: • an increase in HR max • a slower HR in recovery • an increase in lactate max • a slower lactate clearance. • Using this strategy in sets simulates competitive conditions.
Practical Application of Strategy II (Swimming) • Using of swimming sets: • 3 x 400 m :20-30s, 4 x 200 m :15-20s - aerobic energy zone • 4 x 100 m :15-20s, 6 x 50 m 1min - 1min 30s - mix aerobic-anaerobic energy zone • 8 x 25 m :40-60s – anaerobic energy zone • 6 x 12.5 m :30s – sprint, creatine phosphate energy zone • Time trials on various distances
Practical Application of Strategy II (Running) • Using of running sets: • 3 x 1000 m :60s, 4 x 800 m :40s - aerobic energy zone • 4 x 400 m :60s, 6 x 200 m on 1min 30s - mix aerobic-anaerobic energy zone • 8 x 200 m :60s – anaerobic energy zone • 6 x 100 m :90s – sprint, creatine phosphate energy zone • Time trials on various distances
Sets in Strategy II (Swimming) • Examples for swimming sets for sprinters: • 8 x 12.5 m on 60 sec • 6 x 25 m on 40 sec • 4 x 50 m on 1:30 sec • Examples for middle distance swimmers: • 6 x 50 on 1 min • 4 x 75 m :30 sec • 4 x 100 m :30 sec • Examples for distance swimmers: • 8 x 100 m :15 sec • 6 x 200 m :20 sec • 4 x 400 m :20 sec.
Sets in Strategy II (Running) • Examples for running sets for sprinters: • 8 x 30 m on 1:30 • 6 x 50 m on 2:00 • 5 x 60 m on 2:30 • Examples for middle distance runners: • 6 x 100 on 1:30 • 4 x 200 m :60s • 4 x 400 m :90s • Examples for distance runners: • 8 x 400 m :60s • 6 x 600 m :60s • 4 x 800 m :90s
Benefits of Test Sets in Strategy II • Test sets with constant distance: • improve exercise intensity (speed) in prescribed energy zone • monitor exercise intensity (speed), which helps to make decision regarding utilization of accumulated working capacity to this type of workload • If exercise intensity (speed) doesn’t increase during the taper (Strategy 2), workload volumes/ intensities should be adjusted
Training Design in Strategy II (Taper) • Workload Design in Strategy 2 depends on a number of parameters • age, gender, distance orientation, duration of phase, workload volume in preparation phase, current condition, best performances in last season, and goal. • For younger athletes the Strategy 2 should be shorter because of faster adaptation, quicker recovery, and more seasons a year.
Seasonal Plan Structure • Preparation period (accumulation of working capacity – Strategy 1) for sprinters should be shorter, than for distance athletes: • 12-14 weeks vs 16-18 weeks • Competition period (utilization of working capacity to exercise intensity/speed – Strategy 2) for sprinters should be longer, than for distance athletes: • 6-8 weeks vs 3-5 weeks
Number of Repetition in Test Set with Constant Swimming Velocity
E-COACH FOR SWIMMINGTraining Design Software www.globsport.org
TRAINING DESIGN COMPUTER PROGRAMS IN SWIMMING • Based on tracking of thousands of athletes the comprehensive models of adaptation were developed. These models were the basis for our training plan designers: • Tra Plan (1988) • Weekly Designer (1990) • Tra Plan 2 (1992) • On-line Training Plan Designer (1998) • Seasonal Plan Designer (2005) • E-Coach for Swimming (2008)
E-COACH • Software uses individual data to design and describe the workloads up to 7 energy zones • In addition, E-Coach designs dryland volumes and the anticipated progression in selected test sets during the season
E-COACH • E-Coach selects total volumes, intensity, optimal rate of workload progression and reduction during the taper based on: • Age • Gender • Event • History of training • Individual Parameters (best results from last season, current condition, goal, etc.)