1 / 1

Figure S3

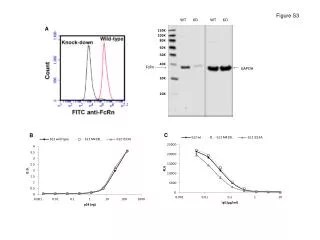
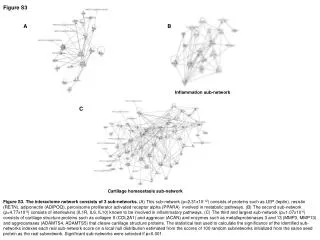
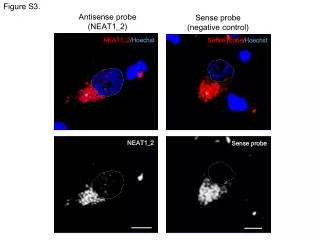
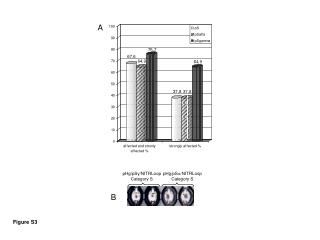
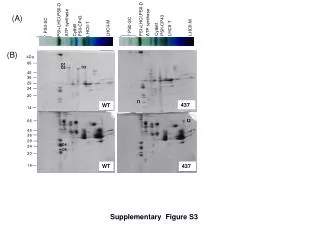
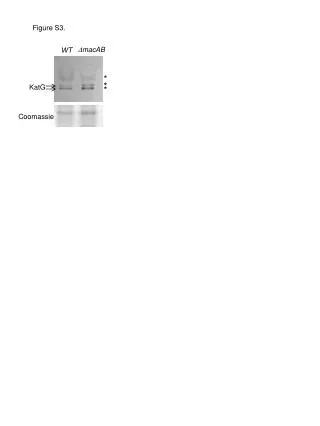
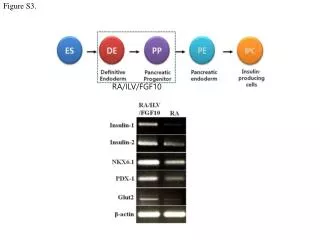
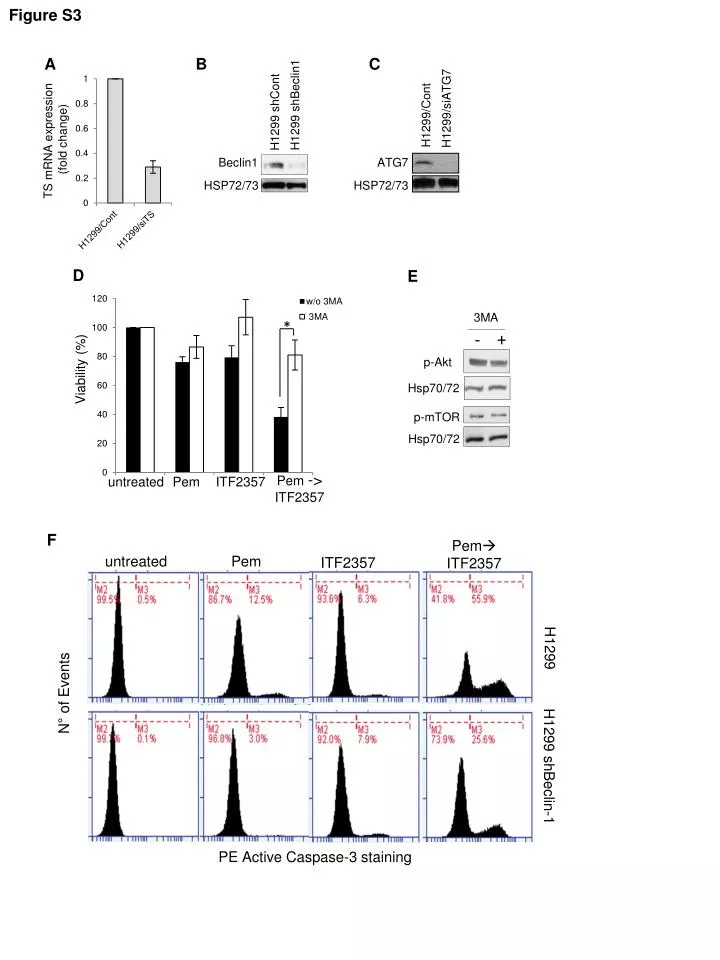
Figure S3. A. B. C. H1299 shBeclin1. H1299/siATG7. H1299 shCont. H1299/ Cont. TS mRNA expression ( fold change ). Beclin1. ATG7. HSP72/73. HSP72/73. D. E. 3MA. - +. p-Akt. Viability (%). Hsp70/72. p-mTOR. *. Hsp70/72. F. Pem  ITF2357. ITF2357. untreated. Pem.

Download Presentation

Figure S3

An Image/Link below is provided (as is) to download presentation Download Policy: Content on the Website is provided to you AS IS for your information and personal use and may not be sold / licensed / shared on other websites without getting consent from its author. Content is provided to you AS IS for your information and personal use only. Download presentation by click this link. While downloading, if for some reason you are not able to download a presentation, the publisher may have deleted the file from their server. During download, if you can't get a presentation, the file might be deleted by the publisher.

E N D

Presentation Transcript


  1. Figure S3 A B C H1299 shBeclin1 H1299/siATG7 H1299 shCont H1299/Cont TS mRNAexpression (foldchange) Beclin1 ATG7 HSP72/73 HSP72/73 D E 3MA - + p-Akt Viability (%) Hsp70/72 p-mTOR * Hsp70/72 F Pem ITF2357 ITF2357 untreated • Pem H1299 N°ofEvents H1299 shBeclin-1 PE ActiveCaspase-3 staining Pem-> ITF2357 Pem ITF2357 untreated

More Related