Download
1 / 27
270 likes | 391 Views
The State of the Art in Information Visualization. Robert Kosara, Helwig Hauser. Overview. Taxonomy Interaction Method Types 1D Methods 2D Methods nD Methods Trees InfoVis and SciVis User Studies Future of InfoVis. Networks/Graphs Temporal Data Text Software. Taxonomy.

E N D
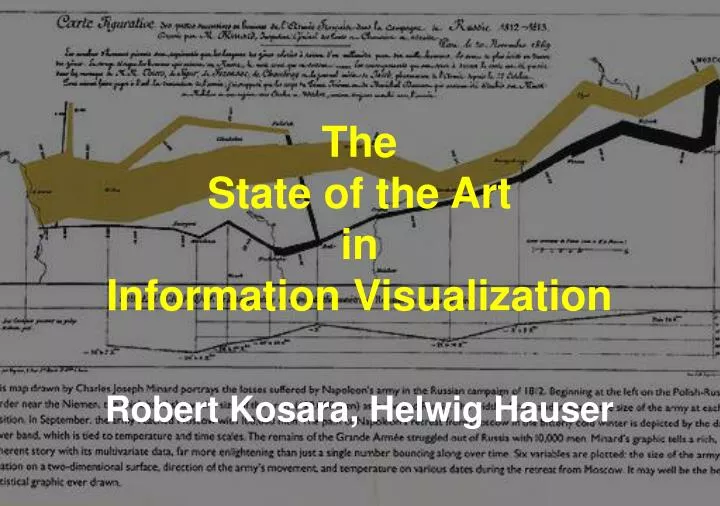
TheState of the ArtinInformation Visualization Robert Kosara, Helwig Hauser InfoVis STAR
Overview • TaxonomyInteractionMethod Types • 1D Methods • 2D Methods • nD Methods • Trees • InfoVis and SciVisUser StudiesFuture of InfoVis • Networks/Graphs • Temporal Data • Text • Software InfoVis STAR
Taxonomy • Most important and most difficult problem • The classic: Shneiderman:VL:1996 • Problems: • Primarily targets data types (not tasks!) • Mixes data and visual dimensions(cone trees are 3D?!) • Strange classifications (text is 1D?!) • Does not account for use of visualization • A different taxonomy is needed InfoVis STAR
Our Taxonomy • Oriented at use of the data • Presentation of the data • How people work with the method • Available interaction methods • One method possibly in several categories InfoVis STAR
Interaction • Focus+Context (F+C) • Distortion-oriented • Magic lenses/Toolglasses • In-Place • A general(ly good) idea • Multiple Views • Linking&Brushing (L&B) InfoVis STAR
F+C: Distortion-oriented • Provide more space for important parts– but don‘t lose context • Methods: • Fisheye Views (Furnas:SIGCHI:1986) • Perspective Wall (Mackinlay:CHI:1991) • Document lens (Robertson:UIST:1993) • Etc. • Review and Taxonomy (Leung:TCHI:1994) InfoVis STAR
F+C: Magic Lenses • Provide more/other information for objects on screen • Several similar techniques • Methods: • 2D Taxonomy (Bier:CHI:1994) • 3D(Viega:UIST:1996) • F+C Screen (Baudisch:UIST:2001) InfoVis STAR
F+C: In-Place • Point the user at important objects – use different style, color, etc. for F+C • Methods: • GeoSpace (Lokuge:CHI:1995) • Cheops (Beaudoin:Vis:1996) • Semantic Depth of Field (SDOF) (Kosara:InfoVis:2001) InfoVis STAR
Multiple Views • Different views on the same data (Baldonado:AVI:2000, North:HCS:2000) • Provide • More and • Different information • Interaction • Focus+Context InfoVis STAR
Linking&Brushing (L&B) • Brush data values in one view • See the same values highlighted in other view (linking) • (Becker:Technometrics:1987) • Different kinds of brushing (Wills:InfoVis:1996) InfoVis STAR
1D Methods • Essentially linear work with data of any dimensionality or structure • Methods • Table Lens (Rao:CHI:1994) • + Multiple focal levels (Tenev:InfoVis:1997) • SuperTable + Scatterplot (Klein:IV:2002) • LensBar (Masui:InfoVis:1998) InfoVis STAR
2D Methods • Overlapping scalar fields and GIS • Scalar fields • Map with bars (Healey:TVCG:1999) • Enridged contour maps (Wijk:Vis:2001) • Oriented texture slivers (Weigle:GI:2000) • Geographical Information Systems (GIS) • GeoSpace (Lokuge:CHI:1995) • Macroscope (Lieberman:UIST:1994) • Etc. InfoVis STAR
High-Dimensional („nD“) Methods • Data is • High-Dimensional • Unstructured • Different Types of Methods • Glyphs • Non-Orthogonal display • Projections and selections • Interaction-rich methods InfoVis STAR
nD: Glyphs • Encode data in the features of an object • Methods • Chernoff faces (Chernoff:AmStat:1973) • Emphatic Visualization Algorithm (Loizides:IV:2002) • Cardiovascular data (Agutter:InfoVis:2001) • Shapes (Ebert:CG:2000) • Stick Figures (Pickett:SMC:1988) InfoVis STAR
nD: Non-Orthogonal Display • Display dimensions non-orthogonally • Methods: • Parallel coordinates (Inselberg:InfoVis:1999) • Angular Brushing (Hauser:InfoVis:2002) • Higher order PCs (Theisel:CGF:1998) • Star plot (Chambers:1983) • Circle Segments (Ankerst:Vis:1996) • Sunflower (Rose:InfoVis:1999) InfoVis STAR
nD: Projections and Selections • Reduce the dimensionality by projection and selection • Methods: • Scatterplot matrix (Cleveland:1985) • Hyperslice (Wijk:Vis:1993),Hypercell (Santos:VisSym:2002) • Dimensional stacking (LeBlanc:Vis:1990) • Prosection Views (Furnas:JCGS:1994),Prosection Matrix (Spence:InfoVis:1995) InfoVis STAR
nD: Interaction-rich Methods • Interaction-intensive methods for nD • Methods: • Worlds within worlds (Feiner:UIST:1990) • Reorderable Matrix (Bertin:1981, Siirtola:IV:1999) • Advizor (Eick:TVCG:2000) InfoVis STAR
Hierarchical (Tree) Data • Very common in literature • Special Case of graphs – but separate methods make sense • Different Methods • Side View • Top View InfoVis STAR
Trees: Side View • Show the branch structure of the tree • Methods • Cone and cam trees (Robertson:CHI:1991) • Generalized cone trees (Jeong:InfoVis:1998) • Cylindrical trees (Dachselt:InfoVis:2001) • Pyramids (Andrews:IV:2002)AsbruView (Kosara:AIMJ:2001) • Botanical tree vis (Wijk:InfoVis:2001) InfoVis STAR
Trees: Top View • Space-filling trees • Methods • Treemap (Shneiderman:ToG:1992) • Squarified treemap (Bruls:VisSym:2000) • Ordered treemap layout (Shneiderman:InfoVis:2001) • Quantum/Bubble treemap (Bederson:UIST:2001) • Cushion treemap (Wijk:InfoVis:1999) InfoVis STAR
Network (Graph) Data • Directed and undirected graphs, computer networks • Methods: • Graph drawing survey (Herman:TVCG:2000) • H3 (Munzner:InfoVis:1997) • Circles (Yee:InfoVis:2001) • MBone (Munzner:InfoVis:1996) • SeeNet (Becker:TVCG:1996) InfoVis STAR
Temporal Data • Record past and plan the future • Past: • Spirals (Alexa:InfoVis:2001) • Cluster & calendar (Wijk:InfoVis:1999) • Future: • SOPOs (Rit:AAAI:1986) • AsbruView (Kosara:AIMJ:2001) InfoVis STAR
Textual Data • Why text is more than one-dimensional • Methods: • SPIRE (Wise:InfoVis:1995) • ThemeRiver (Havre:TVCG:2002) • Shape-based (Rohrer:CGA:1999) • Galaxy of news (Rennison:UIST:1994) InfoVis STAR
Software Visualization • Show structure of program, support software testing • Methods: • Seesoft (Eick:TSE:1992, Ball:Computer:1996) • Program testing (Eagan:InfoVis:2001) • InfoBUG (Chuah:InfoVis:1997) • Program structure (Telea:VisSym:2002) InfoVis STAR
InfoVis and SciVis • Support and enhance SciVis with InfoVis • Examples: • WEAVE (Gresh:Vis:2000) • 3D transfer functions (Kniss:Vis:2001) • Smooth brushing (Doleisch:WSCG:2002) InfoVis STAR
Perception, User Studies • Find out how effective a method is • Papers: • 2D vs. 3D (Robertson:UIST:1998, Smallman:CGA:2001, Tavanti:InfoVis:2001, Cockburn:CHI:2002) • SDOF-Study (Kosara:VisSym:2002) • „Which Blair Project“ (Rogowitz:Vis:2001) • Reorderable matrix study (Siirtola:IV:1999) • Tree visus (Barlow:InfoVis:2001) InfoVis STAR
The Future of InfoVis • Large Data • Fast • Visually effective • More integration of different methods • More interaction in methods • More perception, cognition, studies • InfoVis as secondary task InfoVis STAR