Download
1 / 46
510 likes | 788 Views
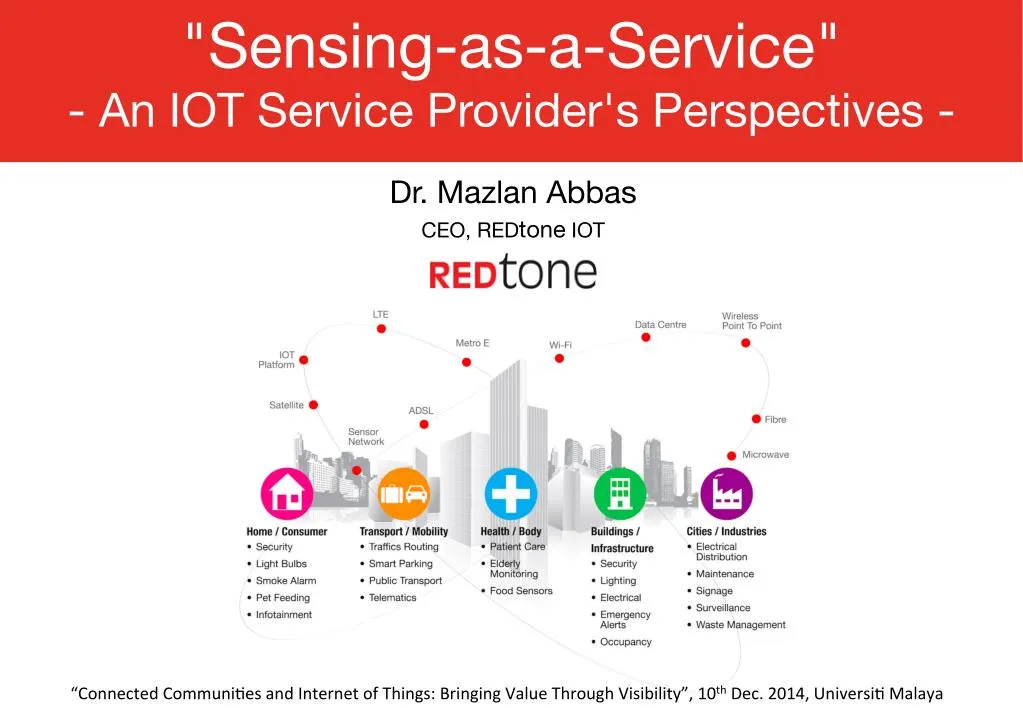
UM-MCMC Connected Communities and Internet of Things (IoT): Building Value through Visibility <br>at Universiti Malaya (UM) <br>Wednesday, December 10, 2014 from 8:00 AM to 4:00 PM (MYT) <br>Kuala Lumpur, Malaysia

E N D
"Sensing-as-a-Service" - An IOT Service Provider's Perspectives - Dr. Mazlan Abbas CEO, REDtone IOT “Connected Communi-es and Internet of Things: Bringing Value Through Visibility”, 10th Dec. 2014, Universi- Malaya
Agenda • Change is Inevitable Because The World is Getting Smarter • Why We Need Smarter Things? • Monetizing the Data – The New Source of Revenue Growth • Sensing-as-a-Service – The New Business Model • The Importance of an IoT Eco-System • Summary
More Connected Devices Than People World 6.8 Billion 7.6 Billion Population 6.3 Billion 7.2 Billion Connected Devices 25 Billion 50 Billion 500 Million 12.5 Billion More connected devices than people 1.84 6.58 Connected Devices Per Person 0.08 3.47 2015 2020 2003 2010 [Source: Cisco IBSG, April 2011]
Building a Smarter World Increased Value Disrupting Value Chains Co-opetition Expanded Boundaries
IOT Poses A New Set of Strategic Choices How value is created and captured? How the amount of new (and sensitive) data is utilized and managed? How relationships with traditional business partners such as channels are redefined? What roles companies should play as industry boundaries are expanded?
The Need to Connect Assets/Objects/Things Knowing our Assets – Typical Questions What Where can I park? condition is my goods. Who is a better and safer bus driver? When is my next train? How reduce my electricity bill? Why my items are not selling? What IF we can connect ALL these assets and get the answers to ALL these questions?
What Are Smart, Connected Products (Things)? Physical Components - comprise the product’s mechanical and electrical parts. Smart Components - amplify the capabilities and value of the physical components Connectivity Components - amplifies the capabilities and value of the smart components and enables some of them to exist outside the physical product itself.
What Can Smart, Connected Things Do? Monitoring Control Op-mize Autonomy
Capabilities of Smart & Connected Things • The product’s condition • The external environment • The product’s operations and usage Monitoring Control • Control of product functions • Personalization of the user experience Optimization • Enhance product performance • Allow predictive diagnostics, service and repair • Autonomous product operation • Self-coordination operation with other products • Autonomous product enhancement and personalization • Self-diagnosis and service Autonomous
44x 2020 80% 35 zettabytes as much Data and Content Over Coming Decade Of world’s data is unstructured 2009 800,000 petabytes
Monetizing the Sensor Data New Source of Revenue Growth
Value is Created By Making Sense of Data More Important Evaluated understanding Wisdom Appreciation of Understanding WHY Answers to questions. HOW Knowledge Answers to questions WHERE WHEN WHO WHAT Information Less Important Data Symbols
Let’s Start with a Blank Template Wisdom Understanding Knowledge Information Evaluated understanding Appreciation of “why” Answers to “how” questions V a l u e Answers to “who”, “what”, “where” and “when” questions Data Symbols Empty (0), Full (1) Who Benefits? – Determine the Stakeholders
Example – Smart Parking Wisdom Understanding Knowledge Information Evaluated understanding NA Why this parking area is not fully occupied? Appreciation of “why” How to implement a tiered charging? How to find “overstayed” vehicles? Answers to “how” questions V a l u e Who park at this lot? What kind of vehicle? Where is the empty parking lot? When is peak period? Empty (0), Full (1) Answers to “who”, “what”, “where” and “when” questions Data Symbols Who Benefits? - Citizens / Parking Operators / City Council / Shops
Example – Hajj & Umrah Wisdom Evaluated understanding NA Why people have problems finding their residence? Why can’t Pilgrims reach on time? Understanding Appreciation of “why” How to make the transport more efficient? How to find the missing Pilgrims? How to move Pilgrims faster? Knowledge Answers to “how” questions V a l u e Who is missing? What happen to the transport? Where is the pilgrim? Where is the exit door? When is peak period? Information Answers to “who”, “what”, “where” and “when” questions Data Symbols ID (0), Residence (1), Transport (2), Location (3) Who Benefits? – Pilgrims, Pilgrim Operators, Mosques, Macca, Medina, etc
IOT Applications Smart Cities 1. Smart Parking 2. Structural Health 3. Noise Urban Maps 4. Traffic Congestion 5. Smart Lighting 6. Waste Management 7. Intelligent Transportation Systems Smart Environment 8. Forest Fire Detection 9. Air Pollution 10. Landslide and Avalanche Prevention 11. Earthquake Early Detection Smart Meter 12. Water Quality 13. Water Leakages 14. River Floods Smart Metering 15. Smart Grid 16. Tank Level 17. Photovoltaic Installations 18. Water Flow 19. Silos Stock Calculation Applica-ons eHealth 50. Fall detection 51. Medical Fridges 52. Sportsmen Care 53. Patients Surveillance 54. Ultraviolet Radiation Networks Security & Emergencies 20. Perimeter Access Central 21. Liquid Presence 22. Radiation Levels 23. Explosive and Hazardous gases Sensors IOT Ecosystem Domotic & Home Automation 46. Energy and Water Use 47. Remote Control Appliances 48. Intrusion Detection Systems 49. Art and Goods Preservation Retail 24. Supply Chain Control 25. NFC Payment 26. Intelligent Shopping Application 27. Smart Product Management Cloud Analy-cs Industrial Control 32. M2M Applications 33. Indoor Air Quality 34. Temperature Monitoring 35. Ozone Presence 36. Indoor Location 37. Vehicle Auto-diagnosis Logistics 28. Quality of Shipment Conditions 29. Item Location 30. Storage Incompatibility Detection 31. Fleet Tracking Smart Animal Farming 43. Offspring Care 44. Animal Tracking 45. Toxic Gas Levels Smart Agriculture 38. Wine Quality Enhancing 39. Green Houses 40. Golf Courses 41. Meteorological Station Network 42. Compost [Reference: http://www.libelium.com/top_50_iot_sensor_applications_ranking ]
WHAT IF – we can create Compound Applications across industries?
The New Meaning for “SaaS” SENSING-AS-A-SERVICE
Sensor Classification Scheme Based on Ownership Commercial Sensor Data Providers Organizations Personal and Households Private Public Business entities who deploy and manage sensors by themselves by keeping ownership. They earn by publishing the sensors and sensor data they own through sensor publishers. Public infrastructure such as bridges, roads, parks, etc. All the sensors deployed by the government will be published in the cloud depending on government policies. All personal items, such as mobile phones, wrist watches, spectacles, laptops, soft drinks, food items and household items, such as televisions, cameras, microwaves, washing machines, etc Private business organization has the right to take the decision whether to publish the sensors attached to those items to the cloud or not. [Source: “Sensing as a Service Model for Smart Cities Supported by Internet of Things”, Charith Perera et. al., Transactions on Emerging Telecommunications Technology, 2014]
iot iot?? Improved Performance Connect & Aggregate? Quantify? Transform? Reduced Costs IOT Platform & Cloud Actionable Insights Business Process Integration Create Innovative Products New Revenue Streams
IOT Technology Stack PRODUCT CLOUD Smart IOT Applications Rules/Analytics Engine Application Platform Product Data Database Integration with Business Systems External Information Sources Identity and Security CONNECTIVITY Network Communication PRODUCT Product Software Product Hardware [Reference: How Smart, Connected Products Are Transforming Competition, Harvard Business Review, Nov. 2014]
Sensing-as-a-Service : The New IOT Business Model IOT Applications / Developers Customers & Decision Makers IOT Middleware Corporations Government iot iot?? Citizens Sensors and Sensor Owners (Personal, Private, Public & Commercial) IOT Example Apps: Smart city Smart environment Security Smart Metering Smart Agriculture With localized analytics With aggregated analytics (With Computation, Storage and Analytics)
Commercial IOT sensors on lamp posts across the city. (Example) Gathering temperature, light, pressure, humidity and pollution. One scenario could be as such: • The city would pay for access to the light sensors in order to decide when to turn on and off the street lights • A university may want access to the pollution information for research purposes for a limited period • The weather department would want the temperature and pressure data • The street town council center would want the temperature and humidity data for planning during rough weather
Sensing-as-a-Service – Smart Environment Lighting City Pollution University Temperature Weather Department 1. 2. 3. 4. 5. Temperature Light Pressure Humidity Pollution. Humidity Street Town Council Commercial Data Sensor Owners iot iot?? Pressure With localized analytics With aggregated analytics
Benefits of SENSING-AS-A-SERVICE
Harnessing the of the Application Developers
Built-in Cloud Services – “Pay-per-Use” or “Subscription-based”
Reduction of Data Acquisition Cost – “Sustainable Business Model”
Collect Data Previously Unavailable – “Assist scientific community or survey activities”
Smartphone as Your “Sensing Assistant” Sensors: • Camera – “Eyes” • Audio – “Ears” • Accelerometer – “Speed” • GPS – “Location” • Gyroscope – “Movement” • Compass – “Direction” • Proximity – “Closeness” • Ambient light – “Eyes” • Others… Crowdsourcing Via Crowdsensing Context 1. Spatial – Location / Speed Orientation 2. Temporal – Time / Duration 3. Environmental – Temperature / Light / Noise Level 4. User Characterization – Activity (Mobility Pattern) / Social (Friends, Interactions) 5. Resource Availability – Storage / Memory / Computational / Battery
NoiseTube – Crowdsourcing of Pollution Data Using Smartphones. What Motivates? Citizens and Communities concerned with noise • Measure your daily sound exposure in dB(A) with your mobile phone • Tag noisy sources to inform the community about them • Visualize your measurements on a map and contribute to the creation of collective, city-wide noise maps • Compare your experience with that of others Local governments / city planners • Improve decision-making by understanding local and global noise pollution in your city using maps and statistics • Get immediate feedback and opinions from citizens • Give immediate feedback to citizens Researchers • Get access to and analyze (anonymized) collective noise data • Find out what is important in soundscape perception Developers • Extend our mobile app in whichever way you see fit • Use our environmental sensor web API to do your own web mashups • • • •
CrowdMag 1. Combining it with magnetic data from other sources, we hope to create near-real-time models of Earth's time changing magnetic field to aid navigation. 2. Mapping static magnetic noise sources (for e.g. power transformer and iron pipes) could potentially improve accuracy of the magnetic navigation systems.
Life-Logging The 150 Days of My Life
30% of all traffic in the average city center is searching for an available parking spot. Cities are losing up to 40% of possible parking revenue through inefficiencies. With smart parking, these inefficiencies are significantly reduced to provide an estimated a 20 – 30% increase in parking revenue.* Reduce the motorist frustration. Real time and reliable. Authorized use of parking. Locate cars that have overstayed Efficient surveillance routes . Optimize parking utilization. NOTE: According to Navigant Research,
SMART CITY Environmental Monitoring 2000 Sensors Temperature CO Noise Car Presence • • • • Moisture temperature Humidity Pluviometer (rain gauge) Anemometer (wind-speed) • • • • Parks and Gardens Irrigation 50 devices in 2 green zones Outdoor Parking Management 400 parking sensors Ferromagnetic sensors • Santander Testbed Mobile Temperature CO Noise Car Presence • • • • Guidance to free parking lots 10 panels located at intersections Environmental Monitoring 150 sensors installed in public vehicles Taking information retrieved by the deployed parking sensors in order to guide drivers towards the available free parking lots • Traffic Intensity Monitoring 60 devices located at main entrance of city Measure main traffic parameters • Traffic volumes • Road occupancy • Vehicle speed • Queue Length •
Crea-ng an IOT Eco-‐System for Malaysia (Smart City) Why Smart City? 1. Due to scale and heterogeneity of the environment 2. Ideal ground for enabling a broad range of very different experiments 3. A huge number of challenging requirements 4. A variety of problem and application domains 5. Allows evaluation of social acceptance of IoT technologies and services via real world pilots 6. An excellent catalyst for IoT research! Application Developers IOT Cloud Device Players Stakeholders Universities Researchers REDtone In Search of The Right Partners
Summary 1. No longer an infrastructure game alone – Software and Apps 2. IoT Adoption - Technology might not be the stumbling block – Finding the Right Business Models 3. Internet of Things (IoT) is NOT a single player game – Ecosystem is important!
THANK YOU People wants to get connected too! Not only Things! People wants to get connected too! Not only Things! EMAIL: mazlan.abbas@redtone.com FACEBOOK: www.facebook.com/drmazlanabbas LINKEDIN: my.linkedin.com/in/mazlan/ SLIDESHARE: www.slideshare.net/mazlan1 TWITTER: mazlan_abbas about.me/mazlan.abbas