Download
1 / 82
820 likes | 847 Views
Explore precipitation patterns and extremes in the U.S., factors influencing climate, statistical properties, and the PRISM modeling system. Get insights from SNOTEL data and PRISM-derived products for accurate climatic analysis.

E N D
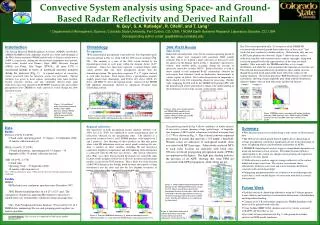
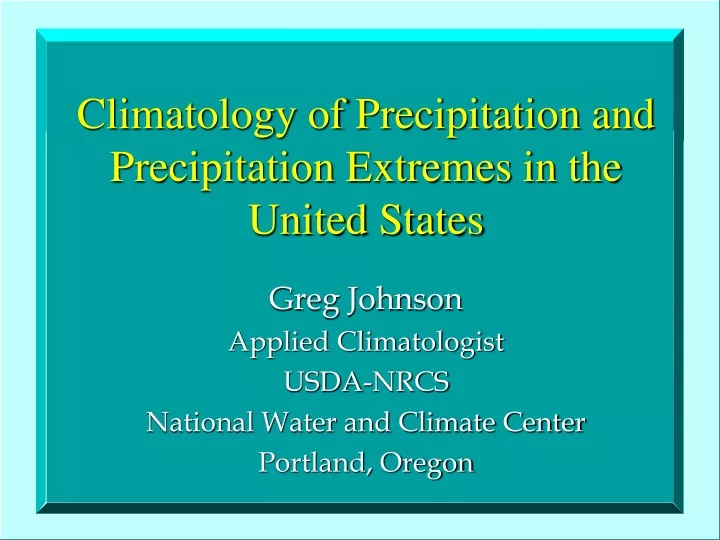
Climatology of Precipitation and Precipitation Extremes in the United States Greg Johnson Applied Climatologist USDA-NRCS National Water and Climate Center Portland, Oregon
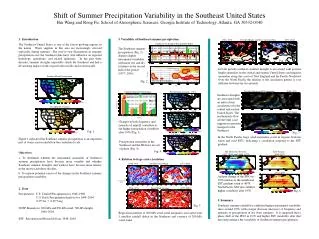
Characteristics of the Mean Precipitation Climate • The principal controlling factors are the availability of atmospheric moisture and lifting mechanisms • Moisture controlled by flow from or proximity to large water bodies • Propensity for lifting influenced by topography, convergence zones (seabreeze, etc.), preferred storm tracks (jet dynamics)
Orographic Precipitation Enhancement Factors • Wind Direction (relative to topography) • Wind Speed • Atmos. Moisture (precipitable water) • Elevation Rise • Slope Angle
Issues of Scale(Spatial and Temporal) • Over long averaging times (say, the 30 year normal maps), only the most important and consistent meteorological factors are evident • Progressively shorter time spans reveal ever-increasing nuances of the atmospheric system
July normal Precipitation (top) versus July 1993 Precipitation (bottom)
Statistical Properties of Precipitation • Persistence, or lack thereof • Average amount of precipitation • Variability in precipitation amount, and theoretical maximum • Frequency of precipitation • Duration of precipitation
A Spatial Climate Modeling System • PRISM (Parameter-elevation Regressions on Independent Slopes Model) • Statistical/Dynamical/Topographic approach • Uses point data, a DEM and a coordinated set of rules, decisions and calculations, designed to mimic an “expert” climatologist • Developed by Dr. Chris Daly of the Spatial Climate Analysis Service, Oregon State University
PRISM • Originally developed for precipitation only, now expanded to temperature, dewpoint, solar radiation and many derived variables such as HDD’s/CDD’s, GDD’s, frost dates, snowfall, snow water equivalent, etc. • Most commonly applied in monthly or annual time increments, but also applied to events
PRISM Model from OSU’sSpatial Climate Analysis Service • Funded primarily by the NRCS-NWCC since 1993 for development of spatial climate products for the U.S. • 4 km horizontal resolution raster data, and ARC polygon coverages both available • Most commonly applied in monthly or annual time increments, but also applied to events
PRISM • Any given grid cell value is determined by a linear regression of station values against elevation • Stations assigned weights • Combined weight of a station is a function of many factors
SNOTEL • Large Automated Climate Network • Began in 1978 • Over 650 remote site • Generally in high elevation areas • Located in the 12 Western States and Alaska • Utilizes meteor burst communication technology to telemeter data
PRISM-derived Products • Mean Mon. and Ann. Precipitation • Mean Mon. and Ann. Temps (mx/mn) • Frost dates and freeze-free season • Extreme winter min. temps & probs. • Growing, heating, cooling degree days • Snow-water equivalent
Cartographic-quality Map of Mean Annual Precipitation for Idaho Produced at the USDA-NRCS NCGC
Annual Precipitation Map of Elmore County, Idaho Produced by the NRCS NCGC “Cut-out” of State Map
PRISM Product Dissemination • Web Sites: OSU: www.ocs.orst.edu/prism/prism_new.html (Raster and polygon coverages of practically everything produced to date (Arc, GRASS); documentation; metadata; DEM’s) NRCS: www.ftw.nrcs.usda.gov/prism/prism.html (U.S., Regional and State mean annual precipitation cartographic products)
http://www.ftw.nrcs.usda.gov/prism/prism.html: • Cartographic state mean annual precipitation maps • Full repository of “official” NRCS PRISM layers
PRISM Product Dissemination • Compact Discs: All precipitation layers for all of the U.S. 3 CD’s (East, Central, West) of the lower 48 states. Includes Arc Explorer viewing software, and all documentation. Available from the NRCS-NCGC: 800-672-5559
PRISM Product Dissemination • Hardcopy maps: Cartographic-quality, walls-size maps of mean annual precipitation for each state Available from the NRCS Climate Data Liaison in each state