Download
1 / 53
530 likes | 806 Views
Transcatheter Aortic Valve Implantation in Inoperable Patients with Severe Aortic Stenosis. Martin B. Leon, MD on behalf of the PARTNER Investigators. TCT 2010; Washington, DC; September 23, 2010. Presenter Disclosure Information for PARTNER at TCT ; September 23, 2010.

E N D
Transcatheter Aortic Valve Implantation in Inoperable Patients with Severe Aortic Stenosis Martin B. Leon, MD on behalf of the PARTNER Investigators TCT 2010; Washington, DC; September 23, 2010
Presenter Disclosure Information for PARTNER at TCT ; September 23, 2010 Martin B. Leon, M.D. • Scientific Advisory Board Edwards Lifesciences, Medtronic, • and SymetisEquity Relationship • Sadra
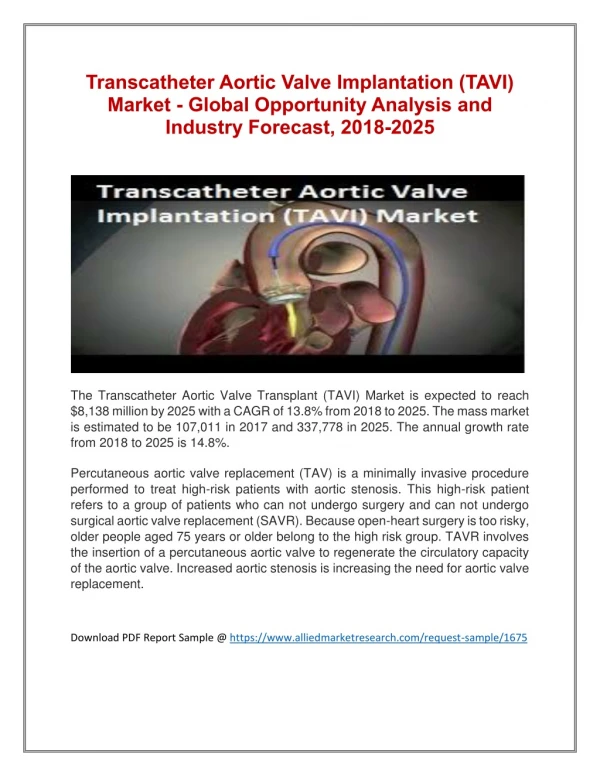
Background There has been explosive growth in transcatheter aortic valve implantation (TAVI) since the first procedure in 2002. Although patient selection, operator skills, and technology have improved, all previous TAVI studies have been observational registries, without standardization of endpoint definitions. There is a paucity of evidence-based clinical data to substantiate incremental benefits of TAVI compared with current standard therapies.
Purpose To assess the safety and effectiveness of TAVI compared with standard therapy, in patients with severe aortic stenosis and cardiac symptoms, who cannot undergo surgery (“inoperable”), using rigorous evidence-based clinical trial methodologies.
PARTNER Study Design Total = 1058 patients n=358 n= 700 2 Parallel Trials: Individually Powered High Risk Inoperable ASSESSMENT: Transfemoral Access ASSESSMENT: Transfemoral Access High Risk TA High Risk TF 1:1 Randomization 1:1 Randomization 1:1 Randomization Not In Study TAVI Trans femoral Surgical AVR Standard Therapy (usually BAV) TAVI Trans femoral Surgical AVR TAVI Trans femoral VS VS VS Primary Endpoint: All Cause Mortality (1 yr)(Non-inferiority) Primary Endpoint: All Cause Mortality over length of trial (Superiority) Symptomatic Severe Aortic Stenosis ASSESSMENT: High Risk AVR Candidate 3105 Total Patients Screened
Primary and Co-Primary Endpoints PRIMARY: All-cause mortality over the duration of the study Superiority test (two-sided), 85% power to detect a difference, α = 0.05, sample size = 350 total patients CO-PRIMARY: Hierarchical composite of all-cause mortality and repeat hospitalization Non-parametric method described by Finkelstein and Schoenfeld (multiple pair-wise comparisons) > 95% power to detect a difference, α = 0.05 Positive study if both endpoints P < 0.05, or if either endpoint is < 0.025
Other Important Endpoints Cardiovascular mortality Repeat hospitalization (after the index procedure) Due to valve or procedure-related clinical deterioration Mortality and repeat hospitalization (KM analysis) Major strokes (modified Rankin Score ≥ 2 @ ≥ 30 days) Mortality and major strokes (KM analysis) Major vascular complications (VARC definition) NYHA symptom classification QOL and cost-effectiveness assessments Six-minute walk tests Echo assessments of valve function (core lab) EOA, mean gradient, aortic regurgitation
Study Administration Co-Principle Investigators Martin B. Leon, Craig R. SmithColumbia University Med Center Executive Committee Martin B. Leon, Michael Mack, D. Craig Miller, Jeffrey W. Moses, Craig R. Smith, Lars G. Svensson, E. Murat Tuzcu, John G. Webb Data & Safety Monitoring Board Chairman: Joseph P. CarrozzaTufts University School of Med Clinical Events Committee Chairman: John L. PetersenDuke University Med Center Echo Core Laboratory Chairman: Pamela C. Douglas Duke University Med Center • Quality of Life and Cost Effectiveness Assessments • Chairman: David J. CohenMid-America Heart Inst, KC • Independent Biostatistical Core Laboratory • Chairman: Stuart PocockLondon School of Hygiene &Tropical Medicine • William N. Anderson • Publications Committee • Co-Chairman: Jeffrey W. Moses, Lars G. Svensson • Sponsor • Edwards Lifesciences: Jodi J. Akin
Executive Committee Lars Svensson Craig Miller Murat Tuzcu Craig Smith Jeff Moses Marty Leon John Webb Michael Mack
Total Enrollment *as of September 1, 2010
Total Enrollment St. Paul's Hospital Vancouver, Canada Univ of WashingtonSeattle, WA Hospital Laval Quebec City, Canada Toronto Gen. Hospital Canada Mayo Clinic Rochester, MN Mass General Boston, MA Brigham & Women’s Boston, MA Intermountain Medical Center Salt Lake City Stanford University Palo Alto, CA Univ. Penn Phila., PA Evanston Hospital Northwestern Univ. Chicago, IL Cornell University Columbia University New York, NY Barnes-Jewish Hospital St. Louis, MO Cleveland Clinic Cleveland, OH Cedars-Sinai Medical Center Los Angeles, CA Washington Hosp. Center Wash., DC St. Luke’s Hospital Kansas City, MO Univ. of Virginia Charlottesville, VA Scripps Clinic La Jolla, CA Emory University Atlanta, GA Medical City Dallas Dallas, TX Leipzig Heart Center Leipzig, Germany n = 1058 patients 26 Investigator Sites 22 USA, 3 Canada, 1 Germany Ochsner Foundation New Orleans, LA Univ. of Miami Miami, FL
Enrollment - Inoperable St. Paul's Hospital Vancouver, Canada Univ of WashingtonSeattle, WA Hospital Laval Quebec City, Canada Toronto Gen. Hospital Canada Mayo Clinic Rochester, MN Mass General Boston, MA Brigham & Women’s Boston, MA Intermountain Medical Center Salt Lake City Stanford University Palo Alto, CA Univ. Penn Phila., PA Evanston Hospital Northwestern Univ. Chicago, IL Cornell University Columbia University New York, NY Barnes-Jewish Hospital St. Louis, MO Cleveland Clinic Cleveland, OH Cedars-Sinai Medical Center Los Angeles, CA Washington Hosp. Center Wash., DC St. Luke’s Hospital Kansas City, MO Univ. of Virginia Charlottesville, VA Scripps Clinic La Jolla, CA Emory University Atlanta, GA Medical City Dallas Dallas, TX Leipzig Heart Center Leipzig, Germany n = 358 patients 21 Investigator Sites 17 USA, 3 Canada, 1 Germany Ochsner Foundation New Orleans, LA Univ. of Miami Miami, FL
Study Devices Edwards-SAPIEN THV Retroflex 1 23mm and 26mm valve sizes 22F and 24F sheath sizes
Inclusion Criteria Severe calcific aortic stenosis defined as echo derived valve area of < 0.8 cm2(EOA index <0.5cm2), and mean gradient > 40 mmHg or jet velocity > 4.0 m/s NYHA functional class II or greater Risk of death or serious irreversible morbidity as assessed by cardiologist and two surgeons must exceed 50%
Key Exclusion Criteria - 1 Aortic valve is bicuspid or non-calcified Aortic annulus diameter (echo measurement) < 18 mm or > 25 mm Aortic dissection or iliac-femoral dimensions or disease which precludes safe sheath insertion Severe LV dysfunction (LVEF < 20%) Untreated CAD requiring revascularization Severe AR or MR (> 3+) or prosthetic valve (any location)
Key Exclusion Criteria - 2 Serum Cr > 3.0 mg/dL or dialysis dependent Acute MI within 1 month Upper GI bleed within 3 months CVA or TIA within 6 months Any cardiac procedure, other than BAV, within 1 month or within 6 months for DES Hemodynamic instability (e.g. requiring inotrope support) Life expectancy < 12 months (or little hope for meaningful lifestyle recovery)
Procedural OutcomesTAVI (179 patients) • 6 (3.4%) pts did not receive TAVI • 2 died before scheduled implant • 2 unsuccessful transfemoral access • 2 intra-procedural annulus measurement too large and procedure aborted • After randomization, median time to TAVI was 6 days (inter-quartile range 3 - 11 days) • During TAVI (first 24 hours) • 2 (1.1%) deaths • 3 (1.7%) major strokes • 1 (0.6%) valve embolization • 2 (1.1%) pts with multiple (≥ 2) valve implants • In the first 30 days, 11 (6.4%) pts receiving TAVI died
Procedural OutcomesStandard Rx (179 patients) • BAV performed in 114 (63.7%) pts ≤ 30 days and an additional 36 (20.1%) pts > 30 days after randomization (total BAV = 83.8% pts) • Despite inoperable status: • 12 (6.7%) pts received AVR • 5 (2.8%) received LV - descAo conduit + AVR • 4 (2.2%) received TAVI outside US • 1-year mortality of pts receiving AVR, AVR-conduit, or TAVI (outside US): • AVR - 33% • AVR + conduit - 80% • TAVI (outside US) - 0%
Standard Rx TAVI All Cause Mortality • HR [95% CI] =0.54 [0.38, 0.78] • P (log rank) < 0.0001 All-cause mortality (%) Months
All Cause Mortality Standard Rx • ∆ at 1 yr = 20.0%NNT = 5.0 pts TAVI 50.7% All-cause mortality (%) 30.7% Months
Compare, at random, every TAVI patient with every Standard Rx patient; 179 x 179 (32,041) patient pairs, which did better? #1, compare “time to death” 72% chance that we know who died first If so, 63% chance that Standard Rx patient died first and 37% chance that TAVI patient died first #2, if necessary, compare “time to repeat hospitalization” 17% chance that we know who had repeat hosp first If so, 75% chance that Standard Rx patient had repeat hosp first and 25% chance that TAVI patient had repeat hosp first Finklestein & Schoenfeld Analysis(hierarchical multiple pair-wise comparison) FS Method Produces a P-value < 0.0001
Study Flow - Inoperable n=179 Standard therapy n=179 TAVI 1 = Withdrawal = 0 5 = Death = 12 173/174 or 99.4% followed at 30 days 167/167 or 100% followed at 30 days 5 = Withdrawal = 0 89 = Death = 55 124/124 or 100% followed at 1 Yr 85/90 or 94.4% followed at 1 Yr n=358 Randomized Inoperable
Cardiovascular Mortality 100 Standard Rx • HR [95% CI] =0.39 [0.27, 0.56] • P (log rank) < 0.0001 TAVI 80 60 Cardiovascualr mortality (%) 40 20 0 Months
Cardiovascular Mortality 100 Standard Rx • ∆ at 1 yr = 24.1%NNT = 4.1 pts TAVI 80 60 44.6% Cardiovascualr mortality (%) 40 20 20.5% 0 Months
Mortality or Repeat Hosp • HR [95% CI] =0.46 [0.35, 0.59] • P (log rank) < 0.0001 100 Standard Rx TAVI 80 60 All-cause mortality orRepeat Hospitalization (%) 40 20 0 Months
Mortality or Repeat Hosp • ∆ at 1 yr = 29.1%NNT = 3.4 pts 100 Standard Rx TAVI 71.6% 80 60 All-cause mortality orRepeat Hospitalization (%) 40 42.5% 20 0 Months
Mortality or Major Stroke 100 • HR [95% CI] =0.58 [0.43, 0.78] • P (log rank) = 0.0003 Standard Rx TAVI 80 60 All-cause mortality orMajor Stroke (%) 40 20 0 Months
Mortality or Major Stroke 100 • ∆ at 1 yr = 18.3%NNT = 5.5 pts Standard Rx TAVI 80 51.3% 60 All-cause mortality orMajor Stroke (%) 40 33.0% 20 0 Months
Mortality vs. Major VascComplicsTAVI patients Major Vascular Complication (n=31) No Major Vascular Complication (n=148) • P (log rank) = 0.069 47.2% Mortality (%) 27.7% Months
Mortality vs. Major Bleeding TAVI patients Major Bleed (n=46) • P (log rank) = 0.0046 No Major Bleed (n=133) 43.5% Mortality (%) 26.3% Months
Mortality vs. Major Stroke TAVI patients • P (log rank) <0.0001 Major Stroke (n=15) No Major Stroke (n=164) 66.7% Mortality (%) 27.7% Months
Subgroup Analyses of Primary Endpoint (All-Cause Mortality) TAVI better Standard Rx better
Subgroup Analyses of Primary Endpoint (All-Cause Mortality) TAVI better Standard Rx better
Six-Minute Walk Tests Walking Distance P = 0.002 P = 0.67 P = 0.004 P = 0.55 Walking distance (meters) Baseline 1 Year 30 Days
Percent TAVI Standard Rx TAVI Standard Rx TAVI Standard Rx TAVI Standard Rx Treatment Visit Baseline 30 Day 6 Month 1 Year NYHA Class Over TimeSurvivors • P = 0.68 • P < 0.0001 • P < 0.0001 • P < 0.0001 I II III IV
Standard Rx 70 TAVI 44.6 44.4 60 39.5 50 33.0 40 Mean Gradient (mm Hg) 30 43.2 12.1 11.3 10.8 20 10 0 Mean Gradients Over Time P < 0.0001 6 Months N=100 1 Year N=89 Baseline N=163 30 Day N=143 • Error bars = ± 1 Std Dev
Paravalvular Regurgitation: TAVI 30 Day 6 Month 1 Year No changes over time None/Trace Moderate Mild Severe
Conclusions - 1 In patients with severe AS and symptoms, who are not suitable candidates for surgery… • Standard therapy (including BAV in 83.8% of pts) did not alter the dismal natural history of AS; all-cause and cardiovascular mortality at 1 year was 50.7% and 44.6% respectively • Transfemoral balloon-expandable TAVI, despite limited operator experience and an early version of the system, was associated with acceptable 30-day survival (5% after randomization in the intention-to-treat population)
Conclusions - 2 • TAVI was superior to standard therapy, markedly reducing the rate of… • all-cause mortality by 46%, P < 0.0001, NNT = 5.0 pts • cardiovascular mortality by 61%, P < 0.0001, NNT = 4.1 pts • all-cause mortality and repeat hospitalization • hierarchical (FS method), P < 0.0001 • non-hierarchical (KM analysis) by 54%, P < 0.0001, NNT = 3.4 pts
Conclusions - 3 • TAVI improved cardiac symptoms (NYHA class, P < 0.0001) and six minute walking distance (P = 0.002), after 1-year follow-up • TAVI resulted in more frequent complications at 30 days, including… • major vascular complications, 16.2% vs. 1.1%, P < 0.0001 • major bleeding episodes, 16.8% vs. 3.9%, P < 0.0001 • major strokes, 5.0% vs. 1.1%, P = 0.06
Conclusions - 4 • Serial echocardiograms in TAVI patients indicated… • reduced mean gradients (P < 0.0001) which were unchanged during 1-year FU • frequent paravalvular AR, which was usually trace or mild (~90%), remained stable during 1-year FU, and rarely required further Rx.