Download
1 / 12
120 likes | 247 Views
1 . 2. 3. 4. 2 4 6 8. Functions and Graphs. A function from a set A to a set B is a rule which links each member of A to one member of B. B. A. This is called an arrow diagram. The function here is ‘multiply by 2’. 1 is mapped to 2, 2 is mapped to 4 etc.

E N D
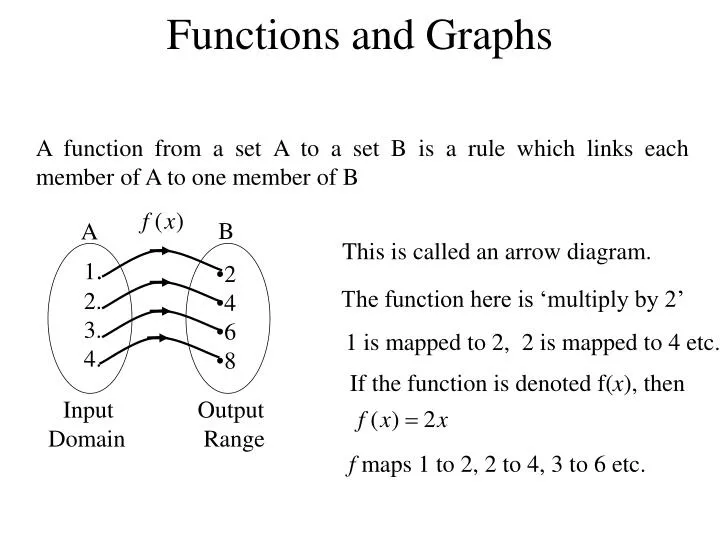
1. 2. 3. 4. • 2 • 4 • 6 • 8 Functions and Graphs A function from a set A to a set B is a rule which links each member of A to one member of B B A This is called an arrow diagram. The function here is ‘multiply by 2’ 1 is mapped to 2, 2 is mapped to 4 etc. If the function is denoted f(x), then Input Output Domain Range f maps 1 to 2, 2 to 4, 3 to 6 etc.
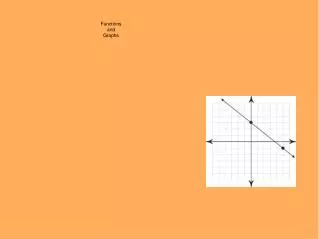
Graphs of Functions A graph gives a picture of a function. It shows the link between the sets of numbers in the input (domain) and the output (range). The straight line is the graph of the function y = 2x for 0 x 6. Output Input Functions which produce a straight line are known as Linear Functions. Linear functions are of the form y = ax + b
The Quadratic Function The parabola shown here is a graph of the function y = x2 for -5 x 5. The graph has a minimum value of 0 when x = 0. Parabolas are symmetrical. The axis of symmetry passes through the turning point of the graph. The axis of symmetry is x = 0. A function of the form y = ax2 + bx + c is a quadratic function. The graph of a quadratic is always a parabola.
Cubic Functions We will now draw the graph of y = x3 x -4 -3 -2 -1 0 1 2 3 4 -64 -27 -8 -1 0 1 8 27 64 y
x -4 -3 -2 -1 0 1 2 3 4 -64 -27 -8 -1 0 1 8 27 64 y Page 24 Exercise 4
Reciprocal Functions x -24 -16 -12 -8 -6 -4 -3 -1 0 1 3 4 6 8 12 16 24 -1 -1.5 -2 -3 -4 -6 -8 –24 __ 24 8 6 4 3 2 1.5 1 y
x -24 -16 -12 -8 -6 -4 -3 -1 0 1 3 4 6 8 12 16 24 -1 -1.5 -2 -3 -4 -6 -8 –24 __ 24 8 6 4 3 2 1.5 1 y NOTE: this function is undefined when x = 0. The shape of the graph is called a hyperbola. It has two branches. The axes are called asymptotes to the curve. This is because the graph approaches but never touches them.
Page 25 Exercise 5 Page 27 Exercise 6 Check up on page 29