Download
1 / 10
100 likes | 267 Views
9.3 Graphing General Rational Functions. The Friedland Method. Rational Function: f(x) = p(x) / q(x). Let p(x) and q(x) be polynomials with no mutual factors. p(x) = a m x m + a m-1 x m-1 + ... + a 1 x + a 0 Meaning : p(x) is a polynomial of degree m

E N D
9.3 Graphing General Rational Functions • The Friedland Method
Rational Function: f(x) = p(x)/q(x) • Let p(x) and q(x) be polynomials with no mutual factors. • p(x)= amxm + am-1xm-1 + ... + a1x+ a0 • Meaning: p(x) is a polynomial of degree m • Example:3x2+2x+5; degree = 2 • q(x) = bnxn + bn-1xn-1 + ... + b1x+ b0 • Meaning:q(x) is a polynomial of degree n • Example:7x5-3x2+2x-1; degree = 5
Key Characteristics • x-intercepts are the zeros ofp(x) • Meaning: Solve the equation: p(x) = 0 • Vertical asymptotes occur at zeros ofq(x) • Meaning: Solve the equation: q(x) = 0 • Horizontal Asymptote depends on the degree of p(x), which is m, and the degree of q(x), which is n. • If m < n, then x-axis asymptote (y = 0) • If m = n, divide the leading coefficients • If m > n, then NO horizontal asymptote.
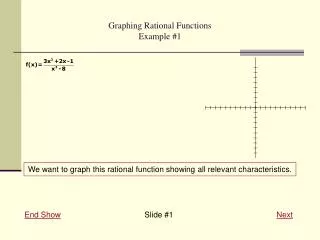
4 • x2+1 Graphing a Rational Function where m < n • Example: Graph y = • State the domain and range. • x-intercepts: None; p(x) = 4 ≠ 0 • Vertical Asymptotes: None; q(x) = x2+ 1. But if x2+ 1 = 0 ---> x2 = -1. No real solutions. • Degree p(x) < Degree q(x) --> Horizontal Asymptote at y = 0 (x-axis)
Let’s look at the picture! • We can see that the domain is ALL REALS while the range is 0 < y ≤ 4
3x2 • x2-4 Graphing a rational function where m = n • Graph y = • x-intercepts: 3x2 = 0 ---> x2 = 0 ---> • x = 0. • Vertical asymptotes: x2 - 4 = 0 • ---> (x - 2)(x+2) = 0 ---> x= ±2 • Degree of p(x) = degree of q(x) ---> divide the leading coefficients ---> • 3 ÷ 1 = 3. • Horizontal Asymptote: y = 3
x y -4 4 -3 5.4 -1 -1 0 0 1 -1 3 5.4 4 4 Here’s the picture! You’ll notice the three branches. This often happens with overlapping horizontal and vertical asymptotes. The key is to test points in each region!
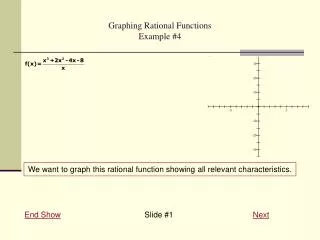
x2- 2x - 3 x + 4 Graphing a Rational Function where m > n • Graph y = • x-intercepts: x2- 2x - 3= 0 • ---> (x - 3)(x + 1) = 0 ---> x = 3, x = -1 • Vertical asymptotes: x + 4 = 0 ---> x = -4 • Degree of p(x) > degree of q(x) ---> No horizontal asymptote
x y -12 -20.6 -9 -19.2 -6 -22.5 -2 2.5 0 -0.75 2 -0.5 6 2.1 Picture time! • Not a lot of pretty points on this one. • This graph actually has a special type of asymptote called “oblique.” It’s drawn in purple. You won’t have to worry about that.
The Big Ideas • Always be able to find: • x-intercepts (where numerator = 0) • Vertical asymptotes (where denominator = 0) • Horizontal asymptotes; depends on degree of numerator and denominator • Sketch branch in each region