Download
1 / 22
220 likes | 371 Views
DESIGN OF A PARAMETRIC OUTLIER DETECTION SYSTEM. Ronald J. Erickson Masters Project Thesis. Background Information.

E N D
DESIGN OF A PARAMETRIC OUTLIER DETECTION SYSTEM Ronald J. Erickson Masters Project Thesis
Background Information • By utilizing a fab-lessmanufacturing system it allows the company stay price competitive. However by using different suppliers many differing failure mechanisms can be introduced into the final integrated circuits. • Integrated circuit defects are discovered during the electrical test of the integrated circuit. These tests are performed on wafers and packaged devices • Radiation tolerant and specialty integrated circuits typically are only built in small quantities. • Radiation tolerant circuits require nonstandard materials, incorporating epitaxial layers, insulating substrates, annular transistors, and doped trenches in the silicon that enhance radiation tolerance
Wafer Test Structure • Using differing wafer fabs, most companies have begun inserting standardized transistor cell structures in the streets of the wafer. • This type of testing is only available at wafer probe test. High reliability devices require testing at different intervals of the manufacturing process. Wafer Die Street Wafer Die Street Sawn
High Reliability • Fab-less companies have the potential of large deviations in material parametrics that must be screened for out of family measurements . • Generally because it cheaper to replace the device than it is to electrically test the device at package level. Most commercial manufacturers have been willing to trade reliability for economics. • Typical service life tends to be longer for military systems and aerospace applications, high reliability devices must be tested at higher level at package to ensure compliance.
Circuit Failure Causes • Wafer fabrication defects • transistor doping, oxide breakdown, interconnect and poly stringers • opens, shorts, resistive metals, bridging materials • metallization stability issues, dissimilar metals like AL & CU. • Potential device assembly defects • wafer back-grind, wafer saw, die preparation • device package defects including trace length, & integrity, package leads • solder ball integrity, die attach, wire bond, hermetic lid seal • Environmental defects on the package and die are caused by simulating • temperature cycle, temperature shock, mechanical vibration • centrifuge, high humidity, salt environment • accelerated and dynamic electrical burn-in causing infant mortality • total ionizing dose (TID), gamma radiation effects on gate oxides, Single Effects SEU, SEL • As a minimum the digital circuit DC parametric tests performed at electrical test are • Continuity, power shorts, input leakage, output tri-state leakage • quiescent power, active power, input and output thresholds • minimum voltage operation • High Reliability circuit measurements usually include the AC electrical parameters • data propagation, input set-up, output/input hold • input rise, input fall, clock duty cycle
Space & High Altitude • Devices are generally placed in service on a system that is in a high altitude or a space. They also impact national security when placed in airport scanners • Expensive and risky to send an astronaut to replace a small faulty integrated circuit or subsystem in space. • 2009 repair of the Hubble space telescope was valued at 1.1 billion dollars. • It is highly visible when a space system fails, the potential government fines and lost business can easily drive a small company into bankruptcy and out of business
Motivations • Design a tool that processes small lots of device parametric data. Performs a robust statistical analysis of the parametric data to screen out of family parametrics within a lot, product line, technology, or fab. • In the real world the need to make decisions and then get on to other business matters is incredibly important.
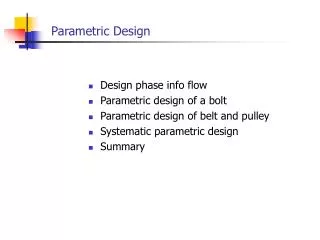
SYSTEM DESIGN & ARCHITECTURE • Requirements were based on brainstorming discussions with stakeholders. • Input distribution of data, analyze the data for a normal Gaussian bell curve distribution, • Perform outlier 75% percentile analysis • Present to the user as a histogram without outliers • Outliers are shown are clipped by the 12.5% percentile and 87.5% percentile • Non-normal distributions are presented in a histogram format so the user can set the lower and upper fences of the data-set before outlier 75% percentile analysis .
Software Engineering • The basic stages • Software requirements • Design • Construction • Testing • Maintenance • CMMI Capability Maturity Model Integration a measure of the software process maturity. • Advanced stages • Software configuration management , tools, quality, process, and knowledge areas
Requirements • Platform base code would be C# used to as the prototype test vehicle, was originally F#. • SQL server supported database implemented relatively easily because of .NET framework. • Differing architecture of the integrated circuit. Some parametric values will correlate can used to detect parametric trending within the wafer fab. • This project implemented a 75% percentile analysis of the normalized data identified by the Anderson-Darling test as the basic default operation.
Normal Distributions 75% percentile analysis of normalized data
Bimodal Distributions Requires User Intervention
Outlier Application Tool Outputs • Min, Max, Median, Mean, Std Deviation • 75% percentile with 12.5% lower & upper 87.5% 75QRange = 87.5% - 12.5% • Q1 = 25% quartile, Q3 = 75% quartile, • IQR = Interquartile Range delta Q1 and Q3, • MadSigma= Median Absolute Deviation • Norm1 = Jarque–Bera test a goodness-of-fit measure from normality, based on kurtosis and skewness • Skew = is a measure of the asymmetry, is distribution weighted left or right? • Kurtosis = measure of peakedness, the higher the value the more extreme the outliers. • Anderson-Darling test p-value > 0.05 for comparison to published critical values
Anderson-Darling • The Anderson-Darling test while having excellent theoretical properties has limitations. • Severely affected by ties in the data. Ties are data points or values that match exactly other data • Anderson-Darling will frequently reject the data as non-normal
Future Implementations • Overcome the limitation of Anderson-Darling on data ties • Investigated clustering the data by using a hybrid format with the standard deviation.
Future Implementations • Mathematical equation k-sample Anderson-Darling test
Conclusions • Integrated circuits designs defects of are only discovered during the electrical test of the device. • Fab-less company introduces even more risk to the development of quality product • Radiation tolerant circuits are built in small quantities. • The use of non-standard materials makes out of family detection much more difficult • Small lot data being used to guarantee a very high FIT rate. high reliable products that provide service within a mission critical sub system.
Lessons Learned • Anderson-Darling limitations on ties in data • Loss of automated functionality, required user intervention • The requirements phase of this project evidenced a lack of appreciation for the true complexity of the project • The problem domain was documented as a set of requirements by managerial stakeholders only. • Design phase a significant amount of additional methods that became more complex to implement as important algorithms of the system
Lessons Learned (continued) • Required additional research to indentify future enhancements to the system. • K-means clustering, Std Deviation, Anderson-Darling hybrid • k-sample Anderson-Darling testing • These methodologies require research before implementation • More robust test modules for testing these complex algorithms