Download
1 / 15
150 likes | 280 Views
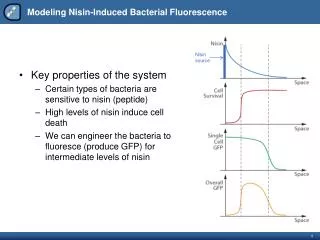
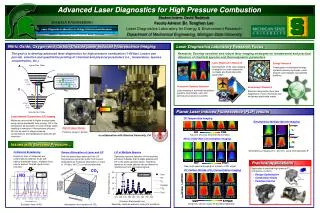
Infrared-Laser Induced Fluorescence and Instrumental Design. Michael W. Morton Geoffrey A. Blake Division of Geology and Planetary Science California Institute of Technology Pasadena, CA 91125. Stable Isotope Studies. Applications include Atmospheric chemistry Geochemistry

E N D
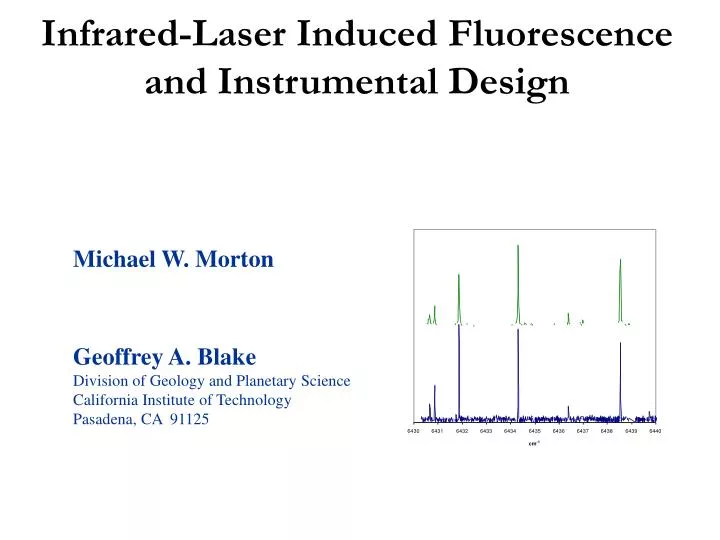
Infrared-Laser Induced Fluorescence and Instrumental Design Michael W. Morton Geoffrey A. Blake Division of Geology and Planetary Science California Institute of Technology Pasadena, CA 91125
Stable Isotope Studies Applications include Atmospheric chemistry Geochemistry Bio-geochemistry Planetary Exploration Specific examples Atmospheric photochemistry Climate studies Biological influences
Instrumentation Mass Spectrometers Utilize mass differences in isotopes, Great for laboratory studies, but not in situ Limitations in planetary exploration: Size, weight Remote operation Sample preparation Sample destruction Isotopomers/ – N15NO 15NNO NN17O Isotopologues in situ Stable Isotope Ratio Spectrometer ? Utilize spectroscopic differences in isotopes
A Brief Look at Photoacoustic Detection Figures courtesy of – Miklos, A. & P, Hess (2001). Am. Inst. Phys., 72, 1938, 1951.
Photoacoustic Considerations Indirect absorption technique signal strength depends on Beer’s law and cell geometry Cell volume and sample size Non-selective detection of mixed samples HDO - D2O Short path length Good sensitivity
Sensitivity of PA Detection Show high laser power spectrum with small peak detection cm-1
IR-LIF Technique • Small instrument size • Remote operation • Little to no sample preparation • non-destructive • Isotopomer resolution • Small sample size Figure courtesy of – Geoff Blake
Instrumental Setup dewar lock-in amplifier scope PC detector filter wheel chopper PA cell wavemeter PC
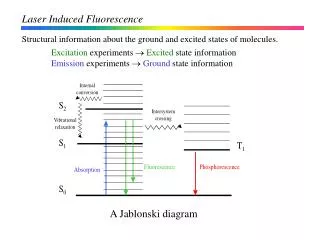
HDO Transitions 1 – OD stretch 2726.73 cm-1 2 – bend 1402.2 3 – OH stretch 3707.47 Pump v1+v3 near 1550 nm (can use telecommunications diode lasers). 6512 6434 0 2 1 1 0 1 3707 1 0 0 cm-1 2727 0 2 0 0 0 1 0 0 0
HDO Vapor Spectrum S/N ~ 90 ~1 pMole HDO in volume imaged onto detector.
Signal and Noise Analysis l1 Why is the signal ~independent of pressure in a pure gas?
Signal and Noise Analysis S/N a√ t out to ~10 sec Microphonic peak (vibrations)
Signal and Noise Analysis Limited by warm window? Figure from – Bernath, P.F. (1995). Oxford University Press, Inc., 8.
Future Work Characterize noise H2O quenching of HDO emissions FM modulation instead of chopper wheel New integrated sample cell on the order of < cm3 Measure isotopic fractionation of water Low pressure studies < 100 mtorr New detector, lasers 1 2 3 4 7 5 6
Acknowledgements Professor Geoff Blake Vadym Kapinus Dr. Pin Chen Dr. Keith Matthews The Blake Group