Download

1 / 27
280 likes | 312 Views
This study explores the challenges of analyzing lncRNA-seq data and evaluates DGE tools for differential gene expression analysis, focusing on lncRNA. Simulations and performance assessments of various DGE tools are conducted to provide insights for researchers.

E N D
department of Data analysis and mathematical modeling Biostatistics Research group Differential Gene Expression Analysis of RNA-sequencingData Evaluation of DGE tools for long non-coding RNA-sequencing data Alemu Takele Assefa1, prof.dr.ir. Olivier Thas1,2, prof.dr.ir. Jo Vandesompele3 1Depertment of Data Analysis and Mathematical Modeling, Ghent University 2National Institute or Applied Statistics Research, University of Wollongong, Wollongong, Australia 3Department of Pediatrics and Medical Genetics, Ghent University, Ghent, Belgium
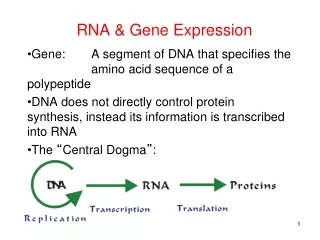
The study of lncRNA is of a major relevance to human health and disease lncRNA • form a large and diverse class of transcribed RNA molecules • constituting up to 70% of the transcriptome with a defined length of 200 nucleotides. • represent an extensive, largely unexplored, and functional component of the genome
lncRNA-seq data is characterized by low signaland high noise • In contrast to mRNA, lncRNAs have lower expression and higher variability • … a fundamental challenge for DGE analysis • noisier inferential behavior noise signal DGE: differential gene expression
DGE analysis of RNA-seq • identifies a set of genes/transcripts that are transcribed with statistically significantly different number of RNA molecules across conditions • e.g. treatment vs control • The assessment of DE can be affected by the analysis pipelines • experiment design, quantification algorithm, normalization procedure, statistical methods, … • the expression magnitude of a gene
DGE analysis tools • Several DGE tools have been introduced each with a unique statistical approach • Negative binomial models (edgeR, DESeq(2), …) • Normal linear models (limma) • (Empirical) Bayesian models (baySeq, EBSeq) • Non-parametric approaches (SAMSeq, NOISeq)
Previous comparative studies lack comprehensiveness and realistic simulation • DGE software tools have been compared in various studies, • However, these studies • focus on mRNA-seq data • rely on parametric simulation procedures • limited use of real RNA-seq data • not comprehensive (limited number of DE tools, scenarios, …)
Overview of common RNA-seq simulation procedures • Parametric:generate counts from a distribution (e.g. NB) with parameters learned from real data • pros: easy, flexible, many scenarios can be simulated, truth is known • cons: unrealistic, biased (beneficial to tools relying on the distribution) • Re-sampling (from one population): sampling from one group and divide into two mock groups • pros: realistic, • cons: single scenario (no DE genes), not flexible, requires large datasets to start from • Re-sampling (from two populations): • pros: realistic, some flexibility, several scenario can be simulated • cons: not fully flexible, requires large datasets to start from
Monte Carlo simulations of RNA-seq experiments allow evaluation of DGE tools performance • simulate RNA-seq data for a given scenario (N, n, m, α, level of variability, …) • apply DEG tool (test DGE) and calculate p-values • adjust p-values to control FDR at αand construct the classification table • compute the FPP (= ) and TPP (=) • repeat 1 – 4 many times (e.g. 1000) and compute the FDR and sensitivity as FDR = average of FPP, and sensitivity = the average of TPP • N = # genes • n = # samples • m = # DE genes • α = nominal FDR level • R = # rejected null hypotheses • V = # rejected true null hypotheses • U = # rejected false null hypotheses Hypothesis i ( i = 1, 2, .. N) H0i: gene i is not DE H1i:gene i is DE
Actual FDR and TPR • 24 DE pipelines • R shiny application • Using countsimQC R package • Non-parametric procedures • various samples sizes • different level of intra-group variability • different proportion of DE genes • constituting of mRNA & lncRNA Analysis of Simulated Data Simulation quality assessment Performance Evaluation Web Tool Simulations Non-parametric procedures are used to simulate realistic gene expression data. • Sub-sampling of samples from a real RNA-seq dataset • using SimSeq R software package • 3 sets of simulations, each starting from a different source data • each source data represent a different level of biological variability: low, intermediate, and high Cultured cell line Intra-group variability Normal tissue Cancer Tissues
Further reading on our paper • Concordance analysis between 25 DE tools using 6 diverse type of real RNA-seq data • similarity in the number of SDE genes • overlapping in the set of SDE • similarity of log-FC estimates • gene ranking agreement • sensitivity to outliers • computation time • DGE pipelines’ recovering ability of a known biological truth
DGE tools perform worse for lncRNAs (also low abundance mRNAs) • e.g. at 5% nominal FDR • edgeR (robust GLM) • mRNA : TPR = 0.82 FDR = 0.051 • lncRNA: TPR = 0.53 FDR = 0.12 • limma (voom) • mRNA : TPR = 0.79 FDR = 0.02 • lncRNA: TPR = 0.45 FDR = 0.052 • SAMSeq (Wilcoxon rank sum test) • mRNA : TPR = 0.81 FDR = 0.052 • lncRNA: TPR = 0.44 FDR = 0.0525
Intra-group biological variability markedly affect the performance of DGE tools • e.g. at 5% nominal FDR • edgeR (robust GLM) • Sim 1: TPR = 0.31 FDR = 0.20 • Sim 2: TPR = 0.53 FDR = 0.12 • limma (voom) • Sim 1: TPR = 0.22 FDR = 0.051 • Sim 2: TPR = 0.45 FDR = 0.052 • SAMSeq (Wilcoxon rank sum test) • Sim 1: TPR = 0.24 FDR = 0.052 • Sim 2: TPR = 0.44 FDR = 0.0525 Sim 1: starts from the Zhang data (cancer tissues) high intra-group variability Sim 2: starts from the NGP nutlin data (cultured cell line data) low intra-group variability
Increasing sample size improves the performance of DGE tools • Increasing number of replicate samples results in • Reduced FDR • Increased sensitivity (TPR)
Sample filtering improves the performance of DGE tools • The first two principal components (PC1 and PC2) demonstrate • the intra-group variability • the inter-group variability • Principal component analysis based on genes with no zero expression after variance stabilizing (DESeq2) transformation of counts. • Samples with the most 10% extreme values of PC1 and PC2 are filtered
Sample filtering improves the performance of DGE tools • Before outlying samples are filtered • e.g. at 5% nominal FDR threshold • edgeR (robust GLM) • mRNA : TPR = 0.25 FDR = 0.09 • lncRNA: TPR = 0.17 FDR = 0.25 • After outlying samples are filtered • e.g. at 5% nominal FDR threshold • edgeR (robust GLM) • mRNA : TPR = 0.33 FDR = 0.053 • lncRNA: TPR = 0.20 FDR = 0.21
Concluding Remarks • Tools lose control of FDR and have low sensitivity for lncRNAs (also low abundance genes) • desirable performance (low FDR and high TPR) is guaranteed only for a • reasonably large number of replicates • for samples with low variability. • accurate DE inference of lncRNAs requires more samples than for mRNAs • No tool uniformly performs better but • limma(with VST; voom; trend), and SAMSeqcontrol the actual FDR reasonably well, while not sacrificing sensitivity.
Concluding Remarks • In the light of promoting reproducible science, it is essential to select a DE tool that succeeds in controlling the FDR level • among these DE tools, one can select one with a high sensitivity • high sensitivities are illusive in the light of the large proportion of false discoveries • Increasing number of replicate samples and removing outlying samples can boost DE tools performance
Web tool • detailed results of our simulation study can be consulted through a user-friendly web application, • giving guidance on selection of the optimal DE tool the tool can be found at http://statapps.ugent.be/tools/AppDGE/
Alemu Takele AssefaPhD studentDepartment of Data Analysis And Mathematical ModellingE AlemuTakele.Assefa@ugent.beT +32 92 64 59 38M +32 486 76 84 55http://biostat.ugent.be • Ghent University@AlemuTakeleAlemu Takele Assefa