Download
1 / 1
10 likes | 165 Views
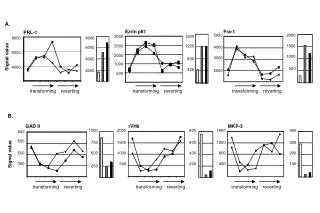
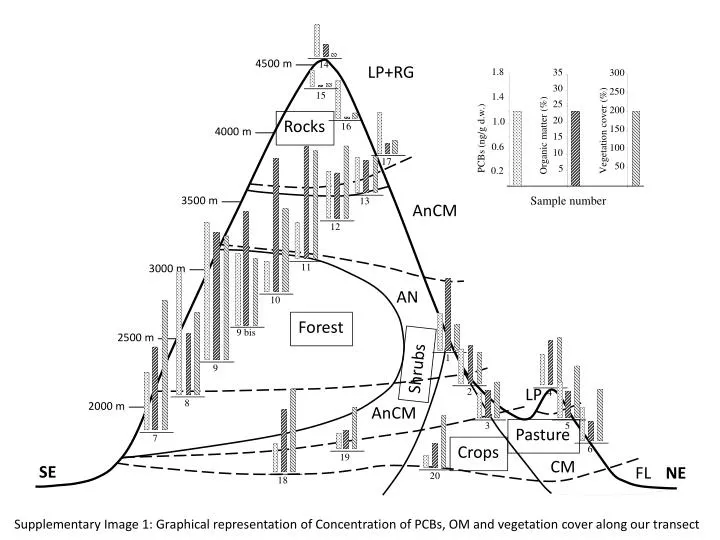
14. 15. 13. 12. 16. 11. 1. 20. 3. 4. 5. 18. 19. 2. 17. 1.8. 35. 300. 30. 250. 1.4. 25. 200. 20. 1.0. Vegetation cover (%). 150. Organic matter (%). PCBs (ng/g d.w. ). 15. 0.6. 100. 10. 50. 5. 0.2. 7. 6. 8. 9. 9 bis. 10. Sample number. LP+RG. 4000 m.

E N D
14 15 13 12 16 11 1 20 3 4 5 18 19 2 17 1.8 35 300 30 250 1.4 25 200 20 1.0 Vegetation cover (%) 150 Organic matter (%) PCBs (ng/g d.w.) 15 0.6 100 10 50 5 0.2 7 6 8 9 9 bis 10 Sample number LP+RG 4000 m 2500 m 4500 m 3500 m 2000 m 3000 m Rocks AnCM AN Forest Shrubs LP AnCM Pasture Crops CM SE FL NE Supplementary Image 1: Graphical representation of Concentration of PCBs, OM and vegetation cover along our transect