Download
1 / 40
410 likes | 835 Views
Richard Bejtlich Principal Consultant, Foundstone searchsecurity@ taosecurity.com www.taosecurity.com. Implementing Network Security Monitoring with Open Source Tools. Introduction. Network Security Monitoring Theory Platform Recommendations Wiretapping Considerations

E N D
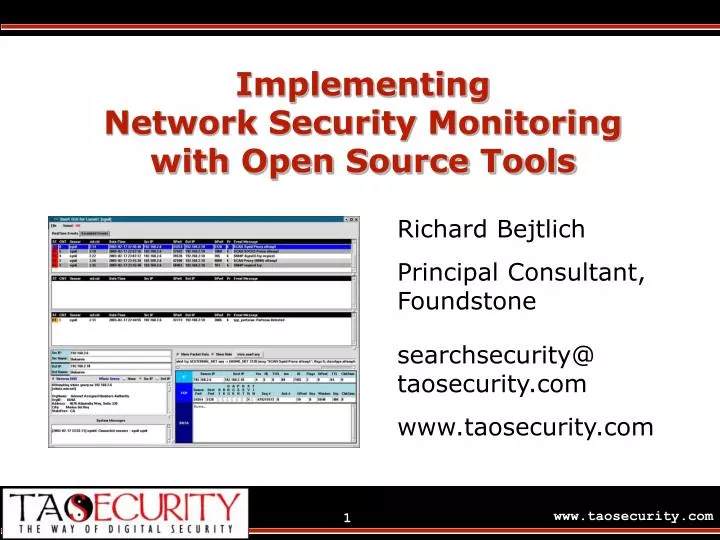
Richard Bejtlich Principal Consultant, Foundstone searchsecurity@ taosecurity.com www.taosecurity.com Implementing Network Security Monitoring with Open Source Tools
Introduction • Network Security Monitoring Theory • Platform Recommendations • Wiretapping Considerations • Full Content Data Collection • Session Data Generation • Event Data Generation • Statistical Data Generation • Implementing NSM: Sguil • Conclusions
Network Security Monitoring Theory • NSM is the collection, analysis, and escalation of indications and warnings (I&W) to detect and respond to intrusions • Intrusions are policy violations • You can’t have an intrusion if you don’t have a security policy • Two realities create de facto policies • Access control lists may or may not limit traffic • Outsiders are generally not tolerated on networks
Platform Recommendations • Operating system: UNIX is best -- Linux or Free/Open/NetBSD; Solaris ok • Windows sits on desktops because it presents a capable, friendly, common environment for users • UNIX should sit on NSM platforms because it offers “securability,” performance, and flexibility • Hardware: Intel x86 works; bare minimums: • 256 MB RAM • 20 GB hard drive • Pentium II
Wiretapping Considerations • Hub between router and firewall • Lose full-duplex link, but cheap • TAP (Test Access Port) between router and firewall • Preserve full-duplex link, but expensive ($400+) and streams must be recombined • Inline device border router and firewall • Bridging firewall introduces another point of failure, but lots of opportunities for detection and prevention • SPAN port on switch outside firewall • Switches concentrate on moving packets, not copying to SPAN port; acceptable if switch cooperates
Wiretapping Considerations • Hub vendors: • I prefer Netgear (http://www.netgear.com) EN104TP 10 Mb/s hubs and avoid 10/100 Mb/s hubs if possible (a switch is inside) • TAP vendors: • I use a Finisar UTP IL/1 (http://www.gofinisar.com/ products/taps/gigE/spGbe-tap.html) for Ethernet • Inline device: • Make your own using OpenBSD • SPAN port: • I plan to test this with a Cisco 2950T-24 switch
SampleTrafficCollectionMethods Each interface on the NSM platform listens promiscuously without an IP address. It collects traffic from the tap, hub, & switch. This is for demo purposes only! By physically connecting all of these segments, the NSM box becomes a prime target. A self-built firewall can collect traffic on its interfaces as well
Wiretapping Considerations • Is this legal? I am not a lawyer, but... • 18 U.S.C. 2511(2)(a)(i) offers the Provider Protection Exception. • Interception is allowed “while engaged in any activity which is a necessary incident to the rendition of service or the protection of the rights or property of the provider of the service.” • Ref: http://www.cybercrime.gov/usc2511.htm • Consent Exception, implemented through banners, gives more explicit legal cover for full collection. • I don’t think DoJ could tolerate the firestorm caused by prosecuting the victim of a “hacker attack”
Data Collection Intro • Open source options: • Full content: TCPDump • Session: Argus • Event: Snort • Statistical: Trafd / Trafshow • Implementing NSM: Sguil • Commercial options listed if available • NSM is not yet widely recognized in the open source or commercial worlds, so tools are rare • Note: when presenting command line options, PowerPoint tends to alter the appearance of single quotes and backticks, so check the screen shots
Full Content Data Collection • TCPDump purpose • Collecting full packet contents offers the greatest flexibility for analysis • Packets can be saved and replayed through most any traffic analysis tool • Every other analysis tool is subject to the selectivity and bias of its creator, while TCPDump sniffs and writes • Greatest possibility for post-incident network-based forensics • Encryption obfuscates content but not headers (tunnel endpoints still visible)
Full Content Data Collection • Libpcap is a library used by many sniffing tools • Libpcap installation • cd /usr/local/src • wget http://www.tcpdump.org/release/libpcap-0.7.2.tar.gz • tar –xzvf libpcap-0.7.2.tar.gz • cd libpcap-0.7.2 • ./configure • make && make install • Libpcap installs a library; there is no “binary” to run
Full Content Data Collection • TCPDump installation • cd /usr/local/src • wget http://www.tcpdump.org/release/tcpdump-3.7.2.tar.gz • tar –xzvf tcpdump-3.7.2.tar.gz • cd tcpdump-3.7.2 • ./configure • make && make install • Since most UNIX boxes have TCPDump already, the original remains in /usr/sbin/tcpdump • The new binary will probably be in /usr/local/sbin
Full Content Data Collection • Common TCPDump switches • Type ‘man tcpdump’ to view more help. • -i <interface>, specify interface to watch traffic • -n, don’t resolve IP addresses or ports to names • -c <n>, stop after collecting n packets • -s <size>, how many bytes of each packet to capture • -w <filename>, specify file to write traffic contents • -r <filename>, specify file to read traffic contents • -tttt, versions 3.6+ use this option to display a date and timestamp for each packet • -X, display hex and ASCII decode (capital X)
Full Content Data Collection • TCPDump typical data collection usage • tcpdump –n –i eth0 –s 1514 –w /nsm/cap.lpc • TCPDump typical data read usage • tcpdump –n –tttt –X –r /nsm/cap.lpc | less • Most people reviewing raw TCPDump data prefer to use Ethereal (www.ethereal.com) • Berkeley Packet Filter (BPF) syntax can modify TCPDump’s behavior • ‘host 10.1.1.1 and port 80’ • ‘net 192.168 and not port 53’ • Note: files written to disk usually have a naming convention based on the time and date the captured started. Also, store data in a dedicated partition, like /nsm, so if collection goes awry only the dedicated partition is filled and the platform stays up.
Full Content Data Collection tcpdump output
Full Content Data Collection Vendors • Sandstorm NetIntercept • http://www.sandstorm.com/ products/netintercept/ • Niksun NetDetector • http://www.niksun.com/index.php?id=194 • I find the NetIntercept’s ability to drill down through traffic and reconstruct content useful, although I’ve only seen demos • Major commercial entities record everything in and out of their networks using these sorts of systems
Session Data Generation • Argus purpose • Interpret IP, TCP, UDP, and ICMP and summarize traffic in “conversation” or “session” format • Generates session tables without storing headers or full content and parsing on the back end • Writes data in proprietary yet compact and feature-rich format • Cannot be fooled by encryption as it cares little for application data • Crafty intruders could use “sessionless” covert channels to fool Argus
Session Data Generation • Argus installation • cd /usr/local/src • wget http://qosient.com/argus/src/argus-2.0.5.tar.gz • tar –xzvf argus-2.0.5 • cd argus-2.0.5 • ./configure • make && make install • Note: Although some think the code is “old,” it seems stable and works well in today’s environments. Development is ongoing. Check the mailing lists.
Session Data Generation • Common Argus ‘argus’ server switches • Type ‘man argus’ to view more help • ‘argus’ is the “server” which collects data • -i <interface>, specify interface to watch traffic • -n, specify PID filename • -c, generate a PID file (helps start and stop argus) • -d, run argus as a daemon in the background • -w <filename>, specify file to write traffic contents • -r <filename>, read pcap-formatted file and generate session data based on that capture • Note: if reading data using ‘-r’, don’t specify ‘-i’
Session Data Generation • Argus typical live data collection usage • Do this to generate session data from live network traffic • argus –i eth0 –n /root/argus.pid –c –d –w /nsm/cap.argus • Argus typical “batch” data collection usage • Do this when processing a pcap file already collected with TCPDump • argus –n /root/argus.pid –c –d –r /nsm/cap.lpc –w /nsm/cap.argus
Session Data Generation • Common Argus ‘ra’ client switches • Type ‘man ra’ to view more help • ‘ra’ is the client used to read data created by the ‘argus’ server • -a, print summary statistics at end • -c, print source and dest byte and packet counts • -n, don’t resolve IP addresses or ports to names • -r <filename>, specify file to read Argus data • -z, -Z b, give more info on TCP states/flags seen • - <BPF filter>, apply BPF filter to target analysis • Write results to text file with redirection ‘> text’
Session Data Generation • Argus ‘ra’ client typical usage • ra –a –c –n –r cap.argus –Z b – not arp • This generates a lot of data and is an example • Omit the ‘-Z b’ switch to ignore TCP flags • The ‘ra’ man page decodes many of the fields, especially ‘STATUS’ • ACC: connection accepted • EST: connection established • TIM: connection timeout • Interpreting Argus data is an art in itself!
Session Data Generation argus output
Session Data Generation • Commercial products • StealthWatch by Lancope (http://www.lancope.com) is flow-based and generates similar data • Products like NetIntercept and NetDetector generate session data after collecting raw traffic and parsing it
Event Data Generation • Snort purpose • Snort, by itself, is an event generation detection engine • Snort must be augmented by third party or do-it-yourself tools to create an enterprise-grade intrusion detection system • The transparency of Snort’s alert generation mechanism helps analysts trust its operation • The ability to rapidly modify and add signatures allows incredible flexibility and response time • Widespread deployment offers global support community
Event Data Generation • Snort installation • cd /usr/local/src • wget http://www.snort.org/dl/snort-2.0.1.tar.gz • tar -xzvf snort-2.0.1.tar.gz • cd snort-2.0.1 • ./configure • make && make install • mkdir /nsm && mkdir /nsm/snort • touch /nsm/snort/alert • Note: This process doesn’t install Snort with database support, or any of the other supporting functions commonly used. This is an intro!
Event Data Generation • Snort use • snort –V (capital ‘V’ to verify Snort install) • snort –b –l /nsm/snort –A full –c /usr/local/src/smort-2.0.1/etc/snort.conf • This tells Snort to log in binary mode to directory /nsm/snort, while logging “full” alert data and reading the specified configuration file • Watch /nsm/snort/alert and /nsm/snort/scan.log for alerts, or use something like Sguil
Event Data Generation Snort output
Event Data Generation Vendors • Sourcefire: http://www.sourcefire.com • Of the commercial IDS predating Sourcefire, Dragon (http://www.enterasys.com) is closest to NSM goals • Opinion: I don’t believe other commercial IDS offer the customization, transparency, and data collection necessary to identify and validate incidents
Statistical Data Generation • trafd / trafshow purpose • trafd shows statistics on data collected on an interface, similar to Cisco accounting data • trafd collects this information in memory and can dump results periodically • Code is not exactly production-grade, but it is useful • trafshow displays real-time statistics on data collected on an interface • trafshow is best used in a reactive mode to quickly check what flow is consuming bandwidth • I like both because they display data in text terminals
Statistical Data Generation • trafd installation • Available at http://www.riss-telecom.ru/pub/dev/trafd/trafd-3.0.1.tgz • Doesn’t compile cleanly on RH 7.3 • Recommend using FreeBSD port in /usr/ports/net/ • trafshow installation • cd /usr/local/src • wget ftp://ftp.nsk.su/pub/RinetSoftware/trafshow-3.1.tgz • cd trafshow-3.1 • ./configure && make && make install
Statistical Data Generation • trafd use • Data collection: trafd –i <interface> • Data retrieval: trafstat –i <interface> -n • Online man pages at http://bpft.by.ru/man_trafd.html and http://bpft.by.ru/man_trafstat.html • trafshow use • trafshow –i <interface> -n <BPF expression> • Type ‘man trafshow’ to view more help • Remember trafshow is a “real time” tool
Statistical Data Generation trafd Note: IP addresses have been truncated for privacy reasons! Real data is complete.
Statistical Data Generation trafshow Note: IP addresses have been truncated for privacy reasons! Real data is complete.
Statistical Data Generation Vendors • Products generating statistics have generally been used for provisioning and network health and welfare • Other open source possibilities include Ntop (http://www.ntop.org) • Some security-oriented commercial products generate statistics • Lancope’s StealthWatch seems particularly robust in this regard
Implementing NSM: Sguil • Sguil purpose • Written “by analysts, for analysts” • Collects and generates event, session, and full content data using Snort • Almost all data necessary to make a decision (i.e., escalate or clear an alert) is within one or two mouse clicks • Client-server architecture allows for running server on UNIX systems (typical NSM platform) and client on Windows systems (typical administrator desktop) • Future versions may allow other NSM-like tools to present their data through Sguil
Implementing NSM: Sguil • Sguil installation • Sguil is still very “beta” and requires following a step-by-step guide available at http://sguil.sourceforge.net/ • Guide provides instructions on installing the server components on a Red Hat 7.3 server from scratch, and running the client on the same system or any Windows client supporting the free Active TCL libraries • Work in progress to ease installation and run Sguil on other platforms
Implementing NSM: Sguil Tabs allow easy access to data • Sguil use Most elements, like IP, port, event, etc., can be used to query for event or session data Top 2 windows show event data Analysts classify, clear or escalate events; choices kept in MySQL This window shows portscan data Here are DNS and ARIN -type lookups, which can be disabled Packet header and contents appear here Chatting and receiving system messages
Implementing NSM Vendors • Commercial options • There aren’t any! • Sguil is open source, so this is not a commercial for Sguil • I plan to write a book titled “The Tao of Network Security Monitoring” which will illustrate these concepts • My upcoming book “Real Digital Forensics” will also present several cases where NSM principles were used in incident response scenarios • Maybe vendors will add these techniques to their arsenal?
Conclusions • NSM is a powerful concept which may change the way you protect your enterprise • Some will complain that they can’t collect this sort of data for reasons of bandwidth, architecture, etc. • This is a problem – you can’t defend what you can’t monitor; can’t stay in business if constantly hacked • If you can’t monitor for security, you probably can’t monitor for performance reasons either • Pick what parts of NSM you can deploy and try it • Doing something is always better than nothing • Security is a game of being “just good enough”