Download
1 / 39
621 likes | 1.12k Views
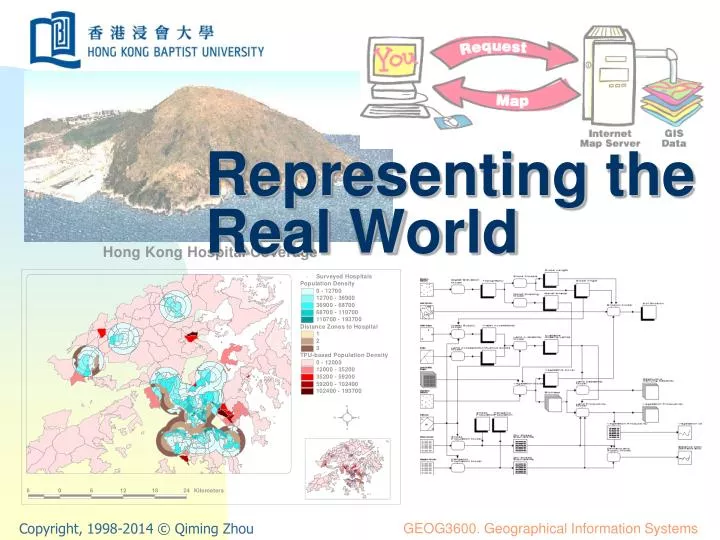
Representing the Real World. Representing the Real World. Representation in GIS Objects and fields Raster and vector representation GIS and maps. Representation in GIS. All human activities requires knowledge about the Earth. Past, present and future Representation occurs in human mind

E N D
Representing the Real World • Representation in GIS • Objects and fields • Raster and vector representation • GIS and maps Representing the Real World
Representation in GIS • All human activities requires knowledge about the Earth. • Past, present and future • Representation occurs • in human mind • in photographs • in spoken and written languages • in numbers (i.e. measurements) • Law of geography: everything relates to everything, but nearby things are more related than those far apart. Representing the Real World
22:00 18:00 14:00 10:00 06:00 Dad’s work School Home Airport City centre Example: representation in space and time Dad Mom Sister Brother Representing the Real World
Representation • Representation help us assemble more knowledge about the Earth than is possible on our own. • e.g. maps • Digital representation • Every item of useful information is ultimately reduced by a GIS to combinations of 0s and 1s. • Digital representation is simple with low costs. Representing the Real World
Geographical representation • Geographical representation is concerned with the Earth’s surface or near surface. • The key representation issues are what to represent and how to represent it. • Many plans for the real world can be tested on models or representations. Representing the Real World
Geographical representation (cont.) • Geographical data link place, time and attributes. • Geographical attributes are classified as nominal, ordinal, interval and ratio. • When enough atoms of geographical information are collected, a complete representation of the world can be built. • Digital earth: to explore the world by interacting with its digital representation Representing the Real World
A geographical place Representing the Real World
Digital representation Map Attributes + time Google Earth Image + roads + places Representing the Real World
But … • The world is infinitely complex. • Computer systems are finite. • Representation is, therefore, all about the choices that are made in capturing knowledge about the world. • Creating spatial models Representing the Real World
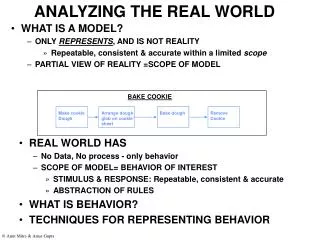
The concept of spatial models The essential function of the spatial data we store and manipulate is to subdivide the Earth’s surface into meaningful entities or objects that can be characterised. In this way, the contents of a spatial database is a model of the Earth. — Star and Estes, 1990, pp 32 Representing the Real World
Objects and fields • The fundamental representation in geography: • Discrete objects • Fields • Discrete object view represents the world as objects with well-defined boundaries in empty space. • The field view represents the real world as a finite number of variables, each one defined at every possible position. Representing the Real World
Example of objects Houses in a countryside are conceived as discrete objects with their clear boundaries and surrounding empty space. Representing the Real World
Database entries of discrete objects Representing the Real World
Object representation in 2D Representing the Real World
Field representation Representing the Real World
Object or field? Representing the Real World
Definition of river • Object view: two-dimensional, discrete object in an empty geographic landscape. • Field view: all points are either river or non-river. • Fuzziness: the “membership” of river River Representing the Real World
Membership of “river” Representing the Real World
Abstraction of geographical entities • Points:locations of, e.g., oil and water wells, bus stops, cities on a small scale map • Lines:centre lines of, e.g., railways, highways, natural streams • Polygons:enclosed regions such as reservoirs, lakes, local government areas • Volumes:solid bodies such as building blocks, mine bodies, capacity of a reservoir • Processes:changing bodies such as landslides, moving objects Representing the Real World
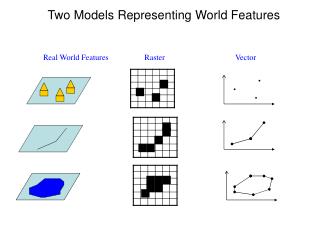
Raster and vector models • There are two fundamental approaches towards the representation of the spatial component of geographical information — the raster and vector models. • In both models, the spatial information is represented using finite, discrete homogeneous units. • In the raster model, the homogeneous units are grid cells (or pixels). • In the vector model, the homogeneous units are points, lines and polygons. Representing the Real World
R E E 6575000 E H R E E H E E R P P E E E R P P P Eucalypts R P P R Pine Forest R R H River H R House R R 6555000 561000 581000 Raster and vector representations Real World Raster Representation Vector Representation Representing the Real World
100 0 0 100 B 2 2 B A 1 1 A Vector to raster data conversion B A Presence/Absence (Points and Linear Features) Percent Occurrence(Areal Features) Dominant Type (Areal Features) Centroid of Cell (Areal Features) Representing the Real World
The raster representation • Divides the entire study area into a regular grid of cells • Each cell contains a single value • Is space-filling since every location in the study area corresponds to a cell in the raster Representing the Real World
The raster coordinates Y (row) X (column) Representing the Real World
3 3 3 3 1 2 2 1 3 3 3 3 1 1 2 2 2 3 3 3 1 1 2 2 3 2 3 3 1 1 2 2 2 1 3 1 1 1 2 2 2 3 1 1 1 1 2 1 3 3 1 1 1 1 1 Raster geographical database Buildings Forest types Soil types Topography Soils Real world Representing the Real World
Resolution • The minimum linear dimension of the smallest unit of geographical space for which data are recorded. • In the raster model, the smallest units are rectangular (for most systems). • The smallest units are known as cells or pixels. • The array of cells is known as lattice, grid or matrix. • High resolution refers to raster with small cells. Representing the Real World
Orientation • The angular difference between the direction depicted as true north and direction facing a designated upper edge of the cartographic plane. • In raster systems, the orientation is defined as the angle between true north and the direction defined by the columns of the raster. Representing the Real World
Australia New South Wales Victoria Queensland South Australia West Australia Tasmania Northern Territory N Y X Resolution and orientation Representing the Real World
10 20 01 02 03 04 05 06 07 08 09 10 11 08 09 10 15 20 28 35 41 48 50 51 01 08 09 11 14 19 25 34 40 47 52 55 02 10 12 15 18 19 25 33 38 48 51 52 03 12 12 15 17 20 15 33 40 47 50 51 04 20 20 20 25 30 32 38 40 45 50 51 05 25 24 26 30 32 37 41 44 47 50 53 06 31 30 32 35 38 40 41 45 50 52 53 07 38 37 39 39 40 41 43 49 51 53 56 08 42 41 42 44 45 48 49 50 52 54 57 09 30 40 50 3-D representation Column number Row number Representing the Real World
3-D surfaces Discrete surface (No slope between Grid Cells) Continuous surface (Continuous slope between Grid Cells) Representing the Real World
The vector representation • Based on vectors • The fundamental primitive is points. • Objects are created by connecting points with straight lines (or arcs). • Areas are defined by sets of lines. Representing the Real World
Y (7, 10) 10 (9, 8) (5, 7) (1, 7) (8, 7) (3, 6) (7, 5) (9, 5) (3, 4) A (5, 3) Y = 3 (2, 3) X 0 X = 2 10 The Vector Coordinates Representing the Real World
A vector data layer Representing the Real World
Triangulated irregular network (TIN) 6 1 A J 11 K 5 B C N I 7 8 L Triangle Table M D 2 10 H … … slope Id# area node# 9 G … … … … … … A 1, 6, 7 E B 1, 7, 8 C 1, 2, 8 4 F D 2, 8, 9 E 2, 3, 9 F 3, 4, 9 3 G 4, 9, 10 H 4, 5, 10 I 5, 10, 11 X-Y Coordinates Z Coordinates J 5, 6, 11 node# coordinates node# z_value K 6, 7, 11 1 x1, y1 1 z1 L 7, 8, 9 2 x2, y2 2 z2 M 7, 9, 10 3 x3, y3 3 z3 N 7, 10, 11 . . . . . . . . . . . . 11 x11, y11 11 z11 Representing the Real World
3-D surfaces represented by TIN Representing the Real World
Comparison between raster and vector approaches Raster approach Vector approach • Advantages: • 1. It is a simple data structure. • 2. Overlay operations are easily and efficiently implemented. • 3. High spatial variability is efficiently represented in a raster format. • 4. The raster format is more or less required for efficient manipulation and enhancement of digital images. • Disadvantages: • 1. The raster data structure is less compact. • 2. Topological relationships are more difficult to represent. • The output of graphics is less aesthetically pleasing because boundaries tend to have a blocky appearance rather than the smooth lines of hand-drawn maps. This can be overcome by using a very large number of cells, but may result in unacceptably large files. • Advantages: • 1. It provides a more compact data structure than the raster model. • 2. It provides efficient encoding of topology, and as a result, more efficient implementation of operations that require topological information, such as network analysis. • 3. The vector model is better suited to supporting graphics that closely approximate hand-drawn maps. • Disadvantages: • 1. It is a more complex data structure than a simple raster. • Overlay operations are more difficult to implement. • 3. The representation of high spatial variability is inefficient. • 4. Manipulation and enhancement of digital images cannot be effectively done in the vector domain. Representing the Real World
GIS and maps • Paper maps is a source of data for geographical databases. • A paper map is an analog product from GIS. • A paper map is an effective communication tool. • portable • easy to use • cheap to make mass production Representing the Real World
Summary • All geographical phenomena need to be represented in some way. • There are two fundamental representation in geography – objects and fields. • Geographical entities can be abstracted as points, lines, polygons, volumes and processes. • Two approaches for representing the geographical entities are vector and raster representations. Representing the Real World