Download
1 / 10
150 likes | 567 Views
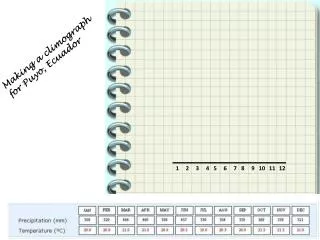
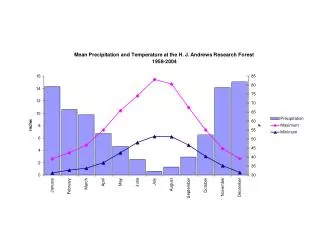
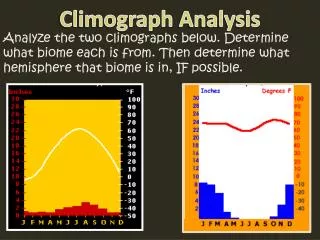
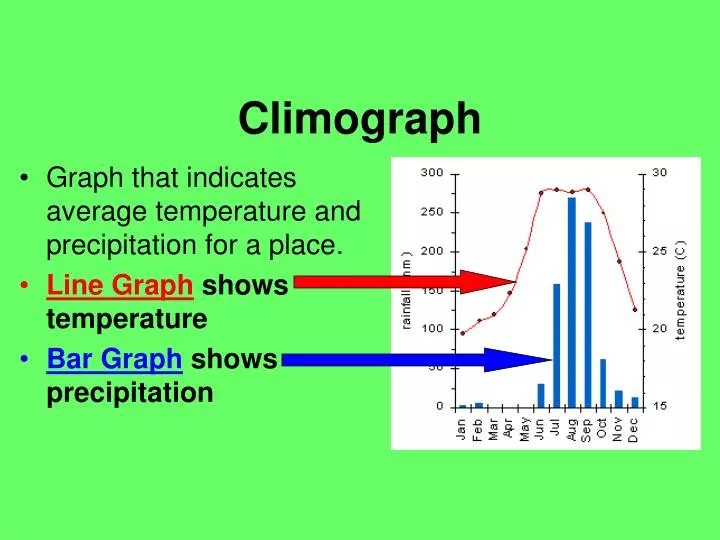
Climograph. Graph that indicates average temperature and precipitation for a place. Line Graph shows temperature Bar Graph shows precipitation. What climate do you think this is?. What climate do you think this is? What hemisphere do you think this location is in?.

E N D
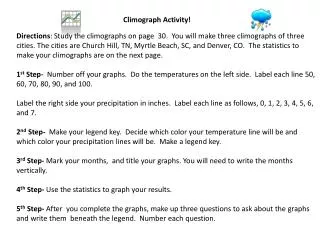
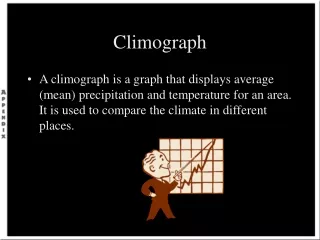
Climograph • Graph that indicates average temperature and precipitation for a place. • Line Graphshows temperature • Bar Graphshows precipitation
What climate do you think this is? What hemisphere do you think this location is in?
More Climographs! http://cwx.prenhall.com/bookbind/pubbooks/lutgens3/medialib/abcontrol/pages/question.html
Click on link, then click on map, animated climographs for California • Animated Climograph