Download
1 / 16
180 likes | 379 Views
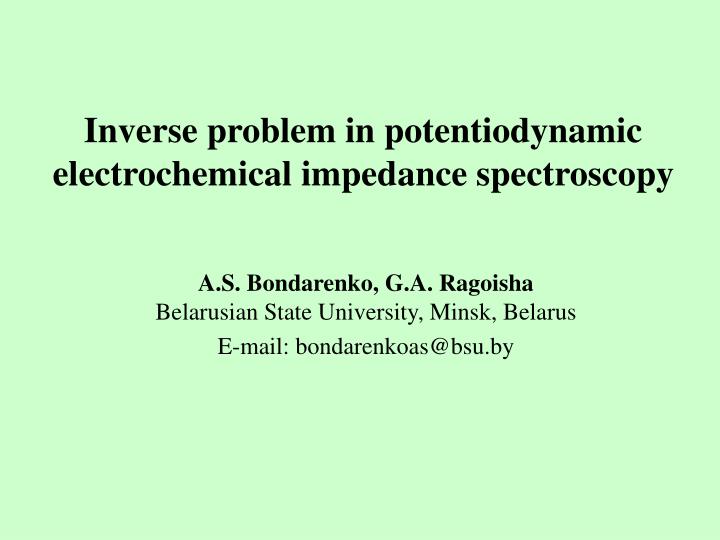
Inverse problem in potentiodynamic electrochemical impedance spectroscopy. A.S. Bondarenko, G.A. Ragoisha Belarusian State University , Minsk, Belarus E-mail: bondarenkoas@bsu.by. Outline. Multidimensional data acquisition in potentiodynamic electrochemical impedance spectroscopy (PDEIS)

E N D
Inverse problem in potentiodynamic electrochemical impedance spectroscopy A.S. Bondarenko, G.A. RagoishaBelarusian State University, Minsk, Belarus E-mail: bondarenkoas@bsu.by
Outline • Multidimensional data acquisition in potentiodynamic electrochemical impedance spectroscopy (PDEIS) • Analysis of 3D PDEIS spectra • Applications
Electrochemical impedance Z is the complex opposition of electrochemical system to alternative current. Z is a two-dimensional value, which is usually represented in complex notation by real impedance Z’ and imaginary impedance Z’’.Electrochemical impedance characterises electrochemical reaction and electrode surface
Impedance Z is a two-dimensional physical quantity Impedance spectrum shows implicitly the frequency response In complex impedance notation Z’ and Z’’characterise different parts of a complex ac response Z’ - the in-phase part; Z’’ – the out-of-phase part With variable potential E the response becomes three-dimensional
PDEIS spectra analysis in terms of equivalent electric circuits Deduction of theoretical models Data acquisition and analysis in PDEIS. Data acquisition Inverse problem solving (2) Inverse problem solving (1) Data acquisition gives 3D impedance spectra and dc current as functions of the electrode potential Circuit parameters as functions of the electrode potential DO – digital output, AO – analog output, AI – analog input
3D PDEIS spectrum 2D “slices” of PDEIS spectrum in different coordinates Cyclic voltammogram The view of the PDEIS spectrometer screen in cyclic potential scanning (3D data acquisition)
dc current (I) Imaginary part of impedance (Z’’) Aniline electropolymerisation Electrode potential (E) Real part of impedance (Z’) PDEIS spectrum represents electrochemical response by means of a 3D graph Ferrocyanide reversible redox transformation
…more examples of 3D PDEIS spectra PDEIS spectra can be used either as visual signatures of systems under investigation, or subjected to further analysis The solution of inverse problem in PDEIS gives more detailed information about the system
3D PDEIS spectrum is considered as a collection of 2D data (the spectrum “is cut” into 2D “slices” on the potential scale with each slice representing impedance spectrum fora certain electrode potential) -Z’’ / Ω Each “slice” will be processed separately in the automatic mode along the potential axis Z’ / Ω E / mV For each of the 2D slices the minimisation problem is solved with complex nonlinear least squares routine, and this gives the parameters of equivalent electric circuits as functions of the potential
Each interfacial process is modeled by its own EEC element Electrochemical interface modeling by equivalent electric circuits (EEC)is a key procedure in the solution of inverse problem EEC comprises common electric circuit elements (resistors, capacitors etc.) and specific electrochemical elements, e.g.impedance of diffusion (Warburg impedance). By means of EEC the total acquired response is decomposed into constituents related to different interfacial processes that take place simultaneously. …
Equivalent electric circuit parameters obtained Equivalent electric circuit Experimental data (2D “slice” of PDEIS spectrum) and fitted curve Spectrum analyser fits 2D slices of a PDEIS spectrum to equivalent circuits sequentially along the potential axis The spectrum analyser window of the virtual spectrometer
The built-in analyser produces the dependences of EEC parameters on the electrode potential(examples ) The dependences of EEC parameters on the electrode potential characterise dynamics of various interfacial processes. Additional information comes from comparison of EEC parameters dependences with theoretical models Cu and Bi monolayers formation accompanied by coadsorption of anions
Calculated curve (solid line) These curves characterise the diffusion of reagents Analysis of constituent responses (1) Equivalent circuit Zw= σ /(jω)0.5 Warburg constant Diffusion of reagent in ferrocyanide redox transformations on glassy carbon
Pt passivation does not affect diffusional parameter… …but affects charge transfer Analysis of constituent responses (2) Thus, information on different aspects of interfacial dynamics is obtained from the same PDEIS spectrum
Inverse problem solving Analysis of the constituent responses (3) Anions co-adsorption during metal monolayer formation Separate monitoring of simultaneous processes and theoretical models development Multivariate data
Conclusions Computer program for analysis of 3D PDEIS spectra has been developed and integrated with the program of PDEIS virtual spectrometer A new approach to investigation of simultaneous nonstationary processes on the electrochemical interface has been developed on the base of analysis of 3D PDEIS spectra Full-text articles about PDEIS available free on Chemweb: G.А. Ragoisha and A.S. Bondarenko, Potentiodynamic electrochemical impedance spectroscopy for solid state chemistry, Solid State Phenom. 90-91 (2003) 103-108. http://preprint.chemweb.com/physchem/0301002 G.А. Ragoisha and A.S. Bondarenko, Investigation of monolayers by potentiodynamic electrochemical impedance spectroscopy, Physics, Chemistry and Application of Nanostructures, World Scientific, 2003, 373-376.http://preprint.chemweb.com/physchem/0301005 G.А. Ragoisha and A.S. Bondarenko, Potentiodynamic electrochemical impedance spectroscopy. A review, Proc. Phys-Chem. Res. Inst., BSU, Minsk, 2003, 138-150; http://preprint.chemweb.com/physchem/0308001 G.A. Ragoisha, A.S. Bondarenko. Potentiodynamic electrochemical impedance spectroscopy of silver on platinum in underpotential and overpotential deposition. Surf. Sci.in press.http://arxiv.org/e-print/cond-mat/0310449