Download
1 / 46
460 likes | 681 Views
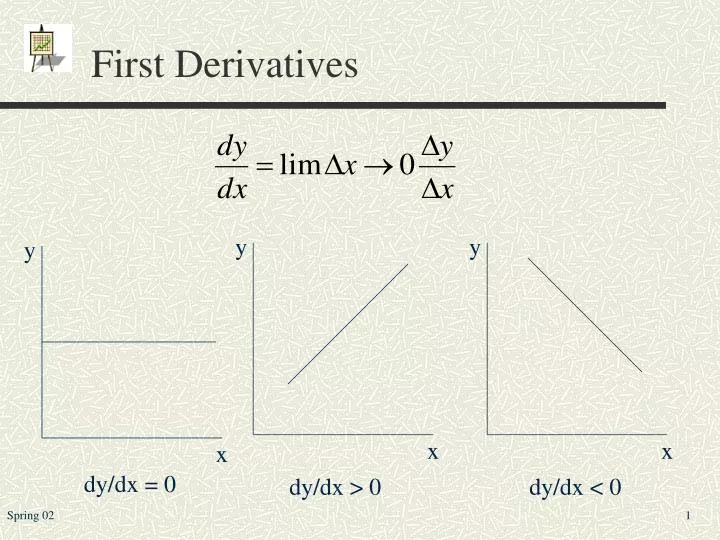
First Derivatives. y. y. y. x. x. x. dy/dx = 0. dy/dx > 0. dy/dx < 0. First Derivatives. y. y. y. y. x. x. x. x. dy/dx < 0. dy/dx > 0. dy/dx < 0. dy/dx > 0. First and Second Derivatives. y. y. x. x. Y is maximized and minimized when dy/dx = 0. Rules of Differentiation.

E N D
First Derivatives y y y x x x dy/dx = 0 dy/dx > 0 dy/dx < 0
First Derivatives y y y y x x x x dy/dx < 0 dy/dx > 0 dy/dx < 0 dy/dx > 0
First and Second Derivatives y y x x Y is maximized and minimized when dy/dx = 0
Expectations Operation If X,Y are independent:
OLS Estimation • In reality: • OLS line: • Error term: • omitted variables • intrinsic randomness • errors in measurement
OLS Estimation • Objectives • Find average Y given X • Test hypothesis • Predict or forecast
OLS Estimation Minimize the sum of the errors squared: Solve simultaneously:
OLS Problem • Given the price and length of the following textbooks, find the relationship between length and price: Book Price Length 1 $11 100 2 $15 225 3 $24 400 4 $20 350
OLS Problem • If X=100, Yhat =$10.46
Special Case Deviations from the mean
Formal Exposition of Model • Model • X is nonstochastic • E(i) = 0 • Var(i) = 2 • E(i,j)=0 for i=j
Gauss Markov Theorem The OLS estimators are BLUE: best, linear, unbiased estimators
Gauss Markov Theorem • The variance of bhat varies: • Directly with the variance of e • Inversely with Sxi2 • The variance of ahat varies: • Directly with s2
Confidence Intervals • Ho: b=bo • Ha: bbo • Ho: a=ao • Ha: aao
Confidence Intervals • Ho: b=0 • Ha: b0 • Ho: a=0 • Ha: a0
Book Example • Test if length is a significant explanatory variable of price • Test if b differs from zero • Ho: b=0 • Ha: b0
Book Example • Test if the intercept differs significantly from zero • Test if a differs from zero • Ho: a=0 • Ha: a0
Goodness of Fit • The residuals can help to explain how well the regression line fits the points. • Variation (not variance!) of Y can be broken down into the portion explained by the regression equation and the unexplained portion (error term) of the model
ANOVA or F-Test • F-distribution is the ratio of two 2 distributions divided by their respective degrees of freedom. • A 2 distribution is the sum of squares of N independently distributed normal random variables. • The basis of the F-test is the idea that the ratio of the explained variation to the unexplained variation should be high if the tested model is a reasonable approximation of the true model.
ANOVA or F-Test • By dividing RSS and ESS by their degrees of freedom, we will convert the variations to variances. • As long as the error terms are normally distributed with a zero mean, the variances will follow a 2distribution.
ANOVA or F-Test • By calculating an F-statistic: • We are testing the hypothesis that: • Ho: b=0 • Ha: b0
ANOVA or F-Test • Since in the bivariate model case, the null hypothesis for the t-test and the F-test are the same, both should give the same accept/reject answer to the null hypothesis • In fact
Scaling and the Units of Measurement • Changing the scale of measurement of the dependent variable changes the corresponding scaling of all the regression coefficients (including residuals and standard errors). • Changing the scale of measurement of a single independent variable changes its coefficient and corresponding standard error but all other statistics are the same.
Forecasting • Point estimate • Interval estimate • Standard error • The prediction variance varies directly with s2 • The denominator of the third term is t-1 times the sample variance of X, so as the variance of X increase, the variance of the prediction decreases • The prediction variance all increase the farther the prediction is from the mean of X.
Book Example • How much will a book that has 300 pages sell for? • Point Estimate Yhat = 6.29 + .0417*300 = $18.80 • 95% Confidence Interval Estimate
Causality • Direction of causality • Casual or causal relationship • Spurious correlation • Simultaneity • Crime and police officers