Download
1 / 1
10 likes | 125 Views
Joint analysis of three seemingly independent microarray experiments via multivariate mixed-model equations with null residual covariance structure. Antonio Reverter 1 , Yong-Hong Wang 1 , Keren A Byrne, Siok Hwee Tan 1 , Gregory S Harper 1 , Heather L. Bruce 2 , and Sigrid A Lehnert 1

E N D
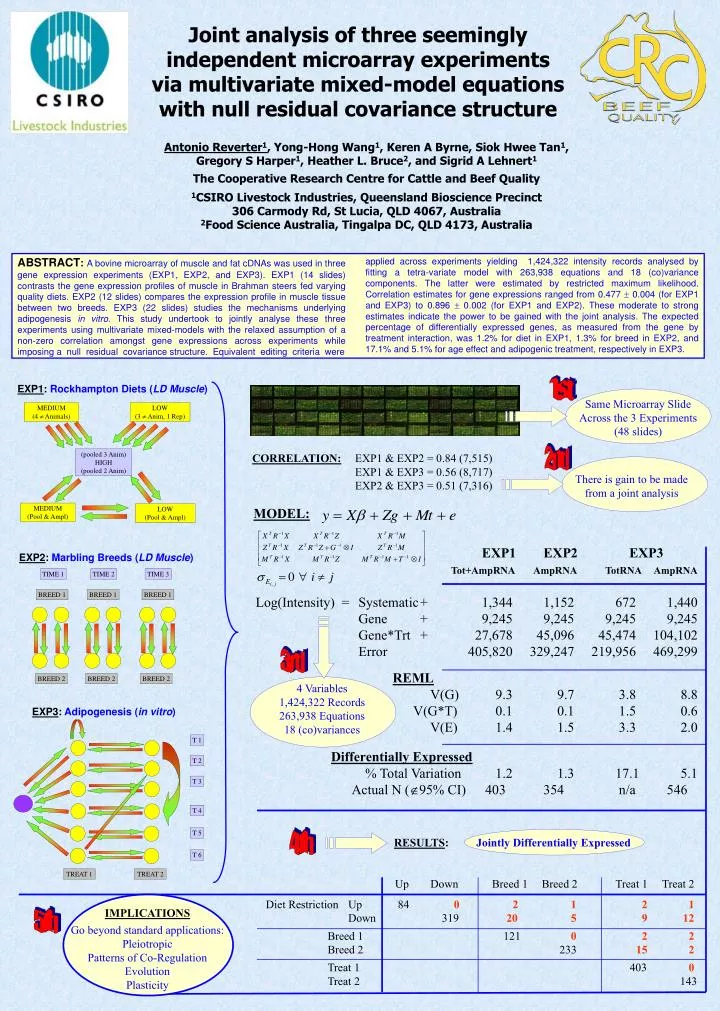
Joint analysis of three seemingly independent microarray experiments via multivariate mixed-model equations with null residual covariance structure Antonio Reverter1, Yong-Hong Wang1, Keren A Byrne, Siok Hwee Tan1, Gregory S Harper1, Heather L. Bruce2, and Sigrid A Lehnert1 The Cooperative Research Centre for Cattle and Beef Quality 1CSIRO Livestock Industries, Queensland Bioscience Precinct 306 Carmody Rd, St Lucia, QLD 4067, Australia 2Food Science Australia, Tingalpa DC, QLD 4173, Australia ABSTRACT:A bovine microarray of muscle and fat cDNAs was used in three gene expression experiments (EXP1, EXP2, and EXP3). EXP1 (14 slides) contrasts the gene expression profiles of muscle in Brahman steers fed varying quality diets. EXP2 (12 slides) compares the expression profile in muscle tissue between two breeds. EXP3 (22 slides) studies the mechanisms underlying adipogenesis in vitro. This study undertook to jointly analyse these three experiments using multivariate mixed-models with the relaxed assumption of a non-zero correlation amongst gene expressions across experiments while imposing a null residual covariance structure. Equivalent editing criteria were applied across experiments yielding 1,424,322 intensity records analysed by fitting a tetra-variate model with 263,938 equations and 18 (co)variance components. The latter were estimated by restricted maximum likelihood. Correlation estimates for gene expressions ranged from 0.477 0.004 (for EXP1 and EXP3) to 0.896 0.002 (for EXP1 and EXP2). These moderate to strong estimates indicate the power to be gained with the joint analysis. The expected percentage of differentially expressed genes, as measured from the gene by treatment interaction, was 1.2% for diet in EXP1, 1.3% for breed in EXP2, and 17.1% and 5.1% for age effect and adipogenic treatment, respectively in EXP3. 1st EXP1: Rockhampton Diets (LD Muscle) Same Microarray Slide Across the 3 Experiments (48 slides) MEDIUM (4 Animals) LOW (3 Anim, 1 Rep) 2nd (pooled 3 Anim) HIGH (pooled 2 Anim) CORRELATION: EXP1 & EXP2 = 0.84 (7,515) EXP1 & EXP3 = 0.56 (8,717) EXP2 & EXP3 = 0.51 (7,316) There is gain to be made from a joint analysis MEDIUM (Pool & Ampl) LOW (Pool & Ampl) MODEL: EXP1 EXP2 EXP3 Tot+AmpRNAAmpRNA TotRNA AmpRNA Log(Intensity) = Systematic + 1,344 1,152 672 1,440 Gene + 9,245 9,245 9,245 9,245 Gene*Trt + 27,678 45,096 45,474 104,102 Error 405,820 329,247 219,956 469,299 EXP2: Marbling Breeds (LD Muscle) TIME 1 TIME 2 TIME 3 BREED 1 BREED 1 BREED 1 3rd REML V(G) 9.3 9.7 3.8 8.8 V(G*T) 0.1 0.1 1.5 0.6 V(E) 1.4 1.5 3.3 2.0 BREED 2 BREED 2 BREED 2 4 Variables 1,424,322 Records 263,938 Equations 18 (co)variances EXP3: Adipogenesis (in vitro) T 1 Differentially Expressed % Total Variation 1.2 1.3 17.1 5.1 Actual N (95% CI) 403 354 n/a 546 T 2 T 3 T 4 T 5 4th RESULTS: Jointly Differentially Expressed T 6 TREAT 1 TREAT 2 Up Down Breed 1 Breed 2 Treat 1 Treat 2 Diet Restriction Up 84 0 2 1 2 1 Down 319 20 5 9 12 Breed 1 121 0 2 2 Breed 2 233 15 2 Treat 1 403 0 Treat 2 143 IMPLICATIONS Go beyond standard applications: Pleiotropic Patterns of Co-Regulation Evolution Plasticity 5th