Download
1 / 368
3.73k likes | 3.81k Views
Learn about Oracle Database architecture, components such as physical and memory structures, tuning actions, and the impact on performance. Gain insights into instance and memory management, shared pool optimization, SQL statement processing phases, and query optimization. Explore top database performance issues and tuning methodologies for enhanced performance.

E N D
Objectives • After completing this lesson, you should be able to: • Describe the Oracle Database architecture and components • Make qualified decisions about your tuning actions
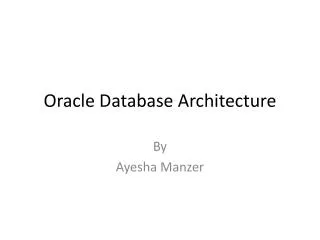
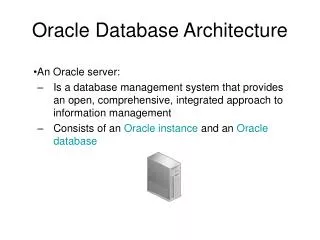
Oracle Database Architecture: Overview • The Oracle Database consists of two main components: • The database: physical structures • The instance: memory structures • The size and structure of these components impact performance.
Oracle Instance Management SGA Shared pool Streams pool Large pool Java pool Database buffer cache Redo log buffer System Monitor SMON Process Monitor PMON Database Writer DBW0 Log Writer LGWR Archived redo log files Check point CKPT Archiver ARC0 Control file Redo log files Data files
Database Physical Structure • Data files Control files • Online redo log files • Archive log files • Parameter file • Password file
Oracle Memory Structures PGA PGA PGA Server process 1 Server process 2 Server process 3 SGA Shared pool Streams pool Large pool Java Pool Database buffer cache Redo log buffer
Automatic Shared Memory Management SGA Shared pool Fixed SGA Large pool Java pool Database buffer cache Redo log buffer Which size to choose?
Shared Pool • The shared pool consists of: • Data dictionary cache containing information on objects, storage, and privileges • Library cache containing information such as SQL statements, parsed or compiled PL/SQL blocks, and Java classes • Appropriate sizing of the shared pool affects performance by: • Reducing disk reads • Allowing shareable SQL code • Reducing parsing, thereby saving CPU resources • Reducing latching overhead, thereby improving scalability
Shared SQL Areas Cursor forSELECT statement 2 Cursor forSELECT statement 1 SGA Shared SQL SELECTstatement 1 SELECTstatement 2 SELECTstatement 1 User A User B User C
Program Global Area (PGA) • PGA is a memory area that contains: • Session information • Cursor information • SQL execution work areas • Sort area • Hash join area • Bitmap merge area • Bitmap create area • Work area size influences SQL performance. • Work areas can be automatically or manually managed.
Automated SQL Execution Memory (PGA) Management • Allocation and tuning of PGA memory is simplified and improved. • Efficient memory allocation for varying workloads • Queries optimized for both throughput and response times • DBAs can use parameters to specify the policy for PGA sizing.
Connecting to an Instance User Server Oracle database User Server Client Application server Server User Server Browser
SQL Statement Processing Phases Open Close Parse Bind Execute Fetch
SQL Statement Processing Phases: Parse • Parse phase: • Searches for the statement in the shared pool • Checks syntax • Checks semantics and privileges • Merges view definitions and subqueries • Determines execution plan • Minimize parsing as much as possible: • Parse calls are expensive. • Avoid reparsing • Parse once, execute many times
SQL Statement Processing Phases: Bind • Bind phase: • Checks the statement for bind variables • Assigns or reassigns a value to the bind variable • Bind variables impact performance when: • They are not used, and your statement would benefit from a shared cursor • They are used, and your statement would benefit from a different execution plan
SQL Statement Processing Phases: Execute and Fetch • Execute phase: • Executes the SQL statement • Performs necessary I/O and sorts for data manipulation language (DML) statements • Fetch phase: • Retrieves rows for a query • Sorts for queries when needed • Uses an array fetch mechanism
SGA Database buffer cache Redo logbuffer Shared pool Processing a DML Statement Database 2 1 Serverprocess Data files 3 UPDATE employees ... Control files 4 Userprocess Redo log files
SGA Database buffer cache Redo logbuffer Shared pool COMMIT Processing Instance Database Serverprocess Data files Control files Userprocess Redo log files LGWR
Functions of the Oracle Query Optimizer • The Oracle query optimizer determines the most efficient execution plan and is the most important step in the processing of any SQL statement. • The optimizer: • Evaluates expressions and conditions • Uses object and system statistics • Decides how to access the data • Decides how to join tables • Decides which path is most efficient
Top Database Performance Issues • Bad connection management • Poor use of cursors and the shared pool • Bad SQL • Nonstandard initialization parameters • I/O issues • Long full-table scans • In-disk sorts • High amounts of recursive SQL • Schema errors and optimizer problems
Summary • In this lesson, you should have learned about the Oracle Database architecture and various components that require tuning.
Objectives • After completing this lesson, you should be able to do the following: • Determine performance problems • Manage performance • Describe tuning methodologies • Identify goals for tuning • Describe automatic SQL tuning features • List manual SQL tuning steps
Performance Problems • Inadequate consumable resources • CPU • I/O • Memory (may be detected as an I/O problem) • Data communications resources • High-load SQL • Contention
Factors to Be Managed • Schema • Data design • Indexes • Application • SQL statements • Procedural code • Instance • Database • User expectations • Hardware and network tuning
Tuning Goals • Reduce the response time • Reduce resource usage
Overview of SQL Tuning • Identify causes of poor performance. • Identify problematic SQL. • Automatic: ADDM, Top SQL • Manual: V$ views, statspack • Apply a tuning method. • Manual tuning • Automatic SQL tuning • Implement changes to: • SQL statement constructs • Access structures such as indexes
Identifying High-Load SQL Identify high-load or problematic SQL • ADDM • Top SQL report • Dynamic performance views • Statspack
Manual Tuning • Gather information about the referenced objects. • Gather optimizer statistics. • Review execution plans. • Restructure SQL statements. • Restructure indexes and create materialized views. • Maintain execution plans.
Gather Information AboutReferenced Objects • SQL text • Structure of tables and indexes • Optimizer statistics • Views • Optimizer plan: current and prior
Gathering Optimizer Statistics • Gather statistics for all tables. • Gather new statistics when existing statistics become stale.
Reviewing the Execution Plan • Driving table has the best filter. • Fewest number of rows are being returned to the next step. • The join method is appropriate for the number of rows being returned. • Views are used efficiently. • There are no unintentional Cartesian products. • Each table is being accessed efficiently. • Examine the predicates in the SQL statement and the number of rows in the table. • A full table scan does not mean inefficiency.
Restructuring the SQL Statements • Compose predicates by using AND and = . • Avoid transformed columns in the WHERE clause. • Avoid mixed-mode expressions and beware of implicit type conversions. • Write separate SQL statements for specific tasks and use SQL constructs appropriately • Use EXISTSor INfor subqueries as required. • Cautiously change the access path and join order with hints.
Restructuring the Indexes • Remove unnecessary indexes to speed the DML. • Index the performance-critical access paths. • Reorder columns in existing concatenated indexes. • Add columns to the index to improve selectivity. • Create appropriate indexes based on usage type: • B*tree • Bitmap • Bitmap join • Concatenated • Consider index-organized tables.
Maintaining Execution Plans over Time • Stored outlines • Stored statistics • Locking statistics
Automatic SQL Tuning • Automatic SQL tuning facilitates these steps: • Gather information on the referenced objects. • Verify optimizer statistics. • Review execution plans. • Restructure SQL statements • Restructure indexes and create materialized views. • Maintain execution plans. • Four types of analysis are performed in automatic SQL tuning: • Statistics analysis • SQL profiling • Access path analysis • SQL structure analysis
Automatic Tuning Mechanisms • You can perform automatic SQL tuning using: • SQL Tuning Advisor • SQL Access advisor
SQL Tuning Advisor • The SQL Tuning Advisor does the following: • Accepts input from: • Automatic Database Diagnostic Monitor (ADDM) • Automatic Workload Repository (AWR) • Cursor cache • Custom SQL as defined by the user • Provides: • Recommendations • Rationale • Expected benefits • SQL commands for implementing the recommendations
Summary • In this lesson, you should have learned how to: • Manage performance • Start early; be proactive • Set measurable objectives • Monitor requirements compliance • Handle exceptions and changes • Identify performance problems • Inadequate consumable resources • Inadequate design resources • Critical resources • Excessive demand
Summary • In this lesson, you should have learned how to: • Tune SQL statements • Analyze the results at each step • Tune the physical schema • Choose when to use SQL • Reuse SQL statements when possible • Design and tune the SQL statement • Get maximum performance with the optimizer
Objectives • After completing this lesson, you should be able to describe the basic steps involved in designing and developing for performance.
Understanding Scalability • Scalability is a system’s ability to process more workload, with a proportional increase in system resource use. • Poor scalability leads to system resource exhaustion to the extent that additional throughput is impossible when the system’s workload is increased.
Scalability with Application Design, Implementation, and Configuration • Applications have a significant impact on scalability. • Poor schema design can cause expensive SQL that does not scale. • Poor transaction design can cause locking and serialization problems. • Poor connection management can cause unsatisfactory response times and unreliable systems.
Configuring the Appropriate System Architecture for Your Requirements • Interactive applications (OLTP) • Process-driven applications (OLAP)
Proactive Tuning Methodology • Simple design • Data modeling • Tables and indexes • Using views • Writing efficient SQL • Cursor sharing • Using bind variables • SQL versus PL/SQL • Dynamic SQL
Simplicity In Application Design • Simple tables • Well-written SQL • Indexing only as required • Retrieving only required information
Data Modeling • Accurately represent business practices • Focus on the most frequent and important business transactions • Use modeling tools • Normalize the data
Table Design • Compromise between flexibility and performance • Principally normalize • Selectively denormalize • Use Oracle performance features • Default values • Check constraints • Materialized views • Clusters • Focus on business-critical tables
Index Design • Index keys • Primary key • Unique key • Foreign keys • Index data that is frequently queried • Use SQL as a guide to index design