Download
1 / 50
500 likes | 609 Views
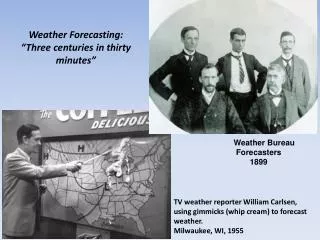
New Applications for Forecasters. EGOWS 2007 Heleen ter Pelkwijk. The items of this presentation. Rich Intranet Application Dashboard Product Generation Application for the use of Conditional Climatology. Rich Intranet Application. Purpose:

E N D
New Applications for Forecasters EGOWS 2007 Heleen ter Pelkwijk
The items of this presentation • Rich Intranet Application • Dashboard • Product Generation • Application for the use of Conditional Climatology
Rich Intranet Application • Purpose: Create an easily accessible operational intranet environment (weather items) for the forecasters.
Rich Intranet Application • Reason: • More than half of the forecasters make frequent use of internet/intranet • Researchers want to have an easily accessible outlet to show the forecasters their experimental products.
Rich Intranet Application • Method: - Creation of two intranet domains: Proeftuin.knmi.nl (the playground for scientists) Oper.knmi.nl (the operational website) - Creation of a combined menu (portal)
Rich Intranet Application • Method: Definition of operational intranet system: Data streams, data processing and the server are monitored and when needed repaired 24 X 7. The experimental site has an operational server but no operational data!
Rich Intranet Application • Result: • The menu is created from a database • All information has a tag “oper” or “exper” • All information has its own unique product number
Rich Intranet Application • Result:
Rich Intranet Application • Result:
Rich Intranet Application • Result:
Rich Intranet Application • Result:
Rich Intranet Application • Result:
Rich Intranet Application • Result:
Rich Intranet Application • Result:
Rich Intranet Application • Conclusion: Do we still need a dedicated meteorological workstation?
The items of this presentation • Rich Intranet Application • Dashboard • Product Generation • Application for the use of Conditional Climatology
Dashboard • Purpose: - Dashboard = the interface of a monitoring tool - Dashboard gives a signal (trigger) in case a severe event occurs.
Dashboard • Reason: - The forecaster has to handle more and more data - The forecaster has to make the right decision as soon as possible • Desired results: • Makes the forecaster aware of important phenomenon as soon as possible • Quality and efficiency • Optimal man-machine mix
Dashboard • Method: Possible monitoring types - observations – products (standard/incidental) - observations – model - model – model - model – product (difference can be a choice) - observation – observation - product – product (consistency) - Product – time (monitoring)
Dashboard: the concept RADAR model ground obs. product editor trigger module detailed info (intranet) trigger dashboard
Dashboard • Realised at this moment • Observations – product - accumulation of precipitation from the radar / limit for a weather alarm - thunderstorm data from “FLITS” / limit for a weather alarm - wind observations / limit for a weather alarm - snow and blowing snow / limit for a weather alarm 2. Model – product - EPS / limit for a weather alarm - EPS / warnings for customers
Dashboard • Result: What does it look like?
Dashboard • Result: What does it look like?
Dashboard • Problems: - Not too many triggers! - How to keep it conveniently arranged
Dashboard • Solutions: - The use of smart mechanisms to reduce the amount of triggers - Filter and sort possibilities - Link triggers to the content of the forecasts
The items of this presentation • Rich Intranet Application • Dashboard • Product Generation • Application for the use of Conditional Climatology
Product Generation • Purpose: Reducing the “routine jobs” by automate part of the standard production.
Product Generation • Reason: • To make more efficient use of the time of the forecaster. • To make more time for the important things during the shift like advising customers and severe weather monitoring. • To make it possible to work with weather dependent shifts…..more time for applied research.
Product Generation • Method:
data objective post processing automatic Product generation customers automatic monitoring Forecaster: 1. Monitoring 2. Monitoring and adapt automatic product generation 3. Not automatic production 4. Not automatic monitoring The red data streams are not monitored by the forecasters!
dashboard auto + mets • Generation of: • Texts (retrieval / text generation) • pictures • triggers Weather dependent loop Basis data (Observations, models, statistic values) Product parts (Text, pictures) Products (product layout)
Weather dependent control by the forecaster Crossing of fixed threshold value(s)? no yes Trigger to the forecaster; A check and possible adjustments. Then distribution. Automatic distribution Extra attention when the product becomes more important
Product Generation • Goal:
Average of 3 stations: Vlissingen, Brasschaat (of Woensdrecht) en Gilze Rijen EPS output Modified long term forecast Precipitation forecast Zoommeer
Available alternative – Amount of observed precipitation in detail
Product Generation • At this moment: Pilot with the use of e-forms
The items of this presentation • Rich Intranet Application • Dashboard • Product Generation • Application for the use of Conditional Climatology
Application for the use of Conditional Climatology • Purpose: An application which makes it possible to give an quick overview of the change in, for instance the visibility, during the next 12 hours, based on climatology. This systems works for fog/low visibility/low clouds
Application for the use of Conditional Climatology • Reason: Give the forecaster an easy access to recent climatological reference material (1977-2006) to help him/her to make the forecast.
Application for the use of Conditional Climatology • Methode: • conditionally • Use of classes (colours => autotaf) Fog (in m) Cloud height (in ft) 0-200 0-200 200-500 200-500 500-800 500-1000 800-1500 1000-1500 1500-3000
Application for the use of Conditional Climatology • Used: • Hourly synops over the past 30 years • 20 stations