Download

1 / 73
730 likes | 888 Views
Chapter 54. Ecosystems. Ecosystems Microcosm: aquarium Lakes, forests. Figure 54.1. Dynamics. Energy flows Matter cycles. Ecosystem ecologists Monitor energy & matter. Tertiary consumers. Microorganisms and other detritivores. Secondary consumers. Primary consumers. Detritus.

E N D
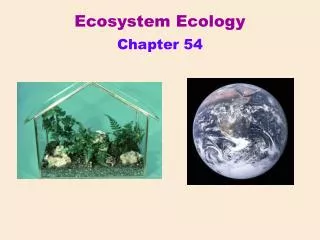
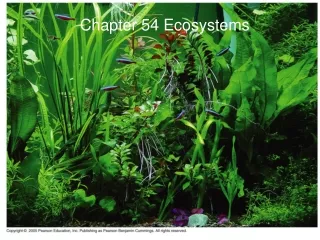
Chapter 54 Ecosystems
Ecosystems • Microcosm: aquarium • Lakes, forests Figure 54.1
Dynamics • Energy flows • Matter cycles
Ecosystem ecologists • Monitor energy & matter
Tertiary consumers Microorganisms and other detritivores Secondary consumers Primary consumers Detritus Primary producers Heat Key Chemical cycling Sun Energy flow Figure 54.2 • Energy flows • Light - heat
Figure 54.3 Decomposition – connects levels • Detritivores, (bacteria, fungi) recycle chemical elements
Primary production • Amount of light energy converted to chemical energy by autotrophs during a given time period
Ecosystem Energy Budgets • The extent of photosynthetic production • Sets the spending limit for the energy budget of the entire ecosystem
The Global Energy Budget • Only a small fraction of solar energy • Actually strikes photosynthetic organisms
Gross and Net Primary Production • GPP – total production • Not all stored as organic material in growing plants
NPP • GPP minus energy used by 1o producers for respiration • Only NPP is available to consumers
125 Open ocean 24.4 65.0 360 Continental shelf 5.2 5.6 1,500 Estuary 0.3 1.2 Algal beds and reefs 2,500 0.1 0.9 Upwelling zones 0.1 500 0.1 Extreme desert, rock, sand, ice 3.0 4.7 0.04 0.9 90 Desert and semidesert scrub 3.5 Tropical rain forest 2,200 22 3.3 2.9 Savanna 900 7.9 9.1 2.7 Cultivated land 600 Boreal forest (taiga) 9.6 2.4 800 1.8 Temperate grassland 600 5.4 Woodland and shrubland 700 1.7 3.5 Tundra 0.6 1.6 140 Tropical seasonal forest 1,600 7.1 1.5 Temperate deciduous forest 1,200 1.3 4.9 1,300 Temperate evergreen forest 1.0 3.8 0.4 Swamp and marsh 2,000 2.3 Lake and stream 0.4 250 0.3 0 10 20 30 40 50 60 0 500 1,000 1,500 2,000 2,500 0 5 10 15 20 25 Key Percentage of Earth’s net primary production Average net primary production (g/m2/yr) (a) (b) Percentage of Earth’s surface area Marine Terrestrial Figure 54.4a–c Freshwater (on continents) NPP varies in ecosystems • And in their contribution to the total NPP on Earth (c)
North Pole 60N 30N Equator 30S 60S South Pole 120W 180 0 60E 120E 180 60W Figure 54.5 Gobal NPP • Terrestrial 2/3 • Marine 1/3
Light Limitation • light penetration • Affects primary production throughout the photic zone of an ocean or lake
Nutrient limitation • Limiting nutrient: element that must be added • for production to increase in a particular area • Nitrogen and phosphorous • most often limit marine production
Table 54.1 • Iron may limit PP
The addition of large amounts of nutrients to lakes • Has a wide range of ecological impacts
Figure 54.7 Eutrophication • Sewage runoff may cause eutrophication
Primary Production in Terrestrial and Wetland Ecosystems • Climate factors such as temperature and moisture affect primary production on a large geographic scale
3,000 Tropical forest 2,000 Net primary production (g/m2/yr) Temperate forest 1,000 Mountain coniferous forest Desert shrubland Temperate grassland Arctic tundra 0 500 1,000 1,500 Actual evapotranspiration (mm H2O/yr) 0 Figure 54.8 Evapotranspiration measurements • Actual evapotranspiration • amount of water annually transpired by plants and evaporated from a landscape • related to net primary production
EXPERIMENT Over the summer of 1980, researchers added phosphorus to some experimental plots in the salt marsh, nitrogento other plots, and both phosphorus and nitrogen to others. Some plots were left unfertilized as controls. Adding nitrogen (N) boosts net primary production. RESULTS 300 N P 250 200 Live, above-ground biomass (g dry wt/m2) N only 150 100 Control P only 50 0 July August 1980 June Experimental plots receiving just phosphorus (P) do not outproduce the unfertilized control plots. CONCLUSION These nutrient enrichment experiments confirmed that nitrogen was the nutrient limiting plant growth in this salt marsh. Figure 54.9 Nutrients • local scale • soil nutrient often limiting
Energy transfer • Between trophic levels < 20% efficient • 2o production • amount of chemical energy in consumers’ food converted to own new biomass during a given period of time
Plant material eaten by caterpillar 200 J Cellular respiration 67 J 100 J Feces 33 J Figure 54.10 Growth (new biomass) Production Efficiency • When a caterpillar feeds on a plant leaf • Only about one-sixth of the energy in the leaf is used for secondary production
Production efficiency of organism • Fraction of energy stored in food that is not used for respiration
Trophic Efficiency and Ecological Pyramids • Trophic efficiency • percentage of production transferred from one trophic level to the next • ranges from 5% to 20%
Tertiary consumers 10 J Secondary consumers 100 J Primary consumers 1,000 J Primary producers 10,000 J Figure 54.11 1,000,000 J of sunlight Pyramids of Production • Shows energy loss
Dry weight (g/m2) Trophic level Tertiary consumers 1.5 Secondary consumers 11 37 Primary consumers Primary producers 809 (a) Most biomass pyramids show a sharp decrease in biomass at successively higher trophic levels, as illustrated by data froma bog at Silver Springs, Florida. Figure 54.12a Biomass pyramids • Show a sharp decrease at successively higher trophic levels
Dry weight (g/m2) Trophic level 21 Primary consumers (zooplankton) Primary producers (phytoplankton) 4 (b) In some aquatic ecosystems, such as the English Channel, a small standing crop of primary producers (phytoplankton)supports a larger standing crop of primary consumers (zooplankton). Figire 54.12b • Certain aquatic ecosystems • Have inverted biomass pyramids
Trophic level Number of individual organisms Tertiary consumers 3 Secondary consumers 354,904 Primary consumers 708,624 Primary producers 5,842,424 Figure 54.13 Pyramids of Numbers
Energy flow dynamics • important for human population • Eating meat • Is a relatively inefficient way of tapping photosynthetic production
Trophic level Secondary consumers Primary consumers Primary producers • Worldwide agriculture could successfully feed many more people • If humans all fed more efficiently, eating only plant material Figure 54.14
The Green World Hypothesis • Terrestrial herbivores consume relatively little plant biomass because they are held in check by a variety of factors
Figure 54.15 • Most terrestrial ecosystems • Have large standing crops despite large numbers of herbivores
Several factors keep herbivores in check • Plant defenses • Nutrients • Abiotic factors • Intraspecific competition • Interspecific interactions
Biogeochemical cycles • Biological and geochemical processes move nutrients between organic and inorganic parts of the ecosystem • Life on Earth • Depends on recycling of essential chemical elements
A General Model of Chemical Cycling • Gaseous forms of carbon, oxygen, sulfur, and nitrogen • Occur in the atmosphere and cycle globally • Less mobile elements, including phosphorous, potassium, and calcium • Cycle on a more local level
Reservoir a Reservoir b Organic materials available as nutrients Organic materials unavailable as nutrients Fossilization Living organisms, detritus Coal, oil, peat Respiration, decomposition, excretion Assimilation, photosynthesis Burning of fossil fuels Reservoir d Reservoir c Inorganic materials unavailable as nutrients Inorganic materials available as nutrients Weathering, erosion Atmosphere, soil, water Minerals in rocks Formation of sedimentary rock Figure 54.16 Model of nutrient cycling • Includes main reservoirs of elements and processes that transfer elements between reservoirs
All elements • Cycle between organic and inorganic reservoirs
THE CARBON CYCLE THE WATER CYCLE CO2 in atmosphere Transport over land Photosynthesis Solar energy Cellular respiration Net movement of water vapor by wind Precipitation over land Precipitation over ocean Evaporation from ocean Burning of fossil fuels and wood Evapotranspiration from land Higher-level consumers Primary consumers Percolation through soil Carbon compounds in water Detritus Runoff and groundwater Decomposition Figure 54.17 Biogeochemical Cycles • The water cycle and the carbon cycle
Water moves in a global cycle • Driven by solar energy • The carbon cycle • Reflects the reciprocal processes of photosynthesis and cellular respiration
THE PHOSPHORUS CYCLE THE NITROGEN CYCLE N2 in atmosphere Rain Plants Weathering of rocks Geologic uplift Runoff Assimilation Denitrifying bacteria Consumption NO3 Sedimentation Nitrogen-fixing bacteria in root nodules of legumes Plant uptake of PO43 Decomposers Nitrifying bacteria Soil Nitrification Leaching Ammonification NO2 NH3 NH4+ Nitrogen-fixing soil bacteria Nitrifying bacteria Decomposition Figure 54.17 • The nitrogen cycle and the phosphorous cycle
Consumers Producers Decomposers Nutrients available to producers Abiotic reservoir Geologic processes Figure 54.18 Decomposition and Nutrient Cycling Rates • Decomposers (detritivores) play a key role
Nutrient cycling rates • Are extremely variable, mostly as a result of differences in rates of decomposition
Vegetation and Nutrient Cycling: The Hubbard Brook Experimental Forest • Nutrient cycling • Is strongly regulated by vegetation
(a) Concrete dams and weirs built across streams at the bottom of watersheds enabled researchers to monitor the outflow of water and nutrients from the ecosystem. Figure 54.19a Hubbard Brook • The research team constructed a dam on the site • To monitor water and mineral loss
(b) One watershed was clear cut to study the effects of the lossof vegetation on drainage and nutrient cycling. Figure 54.19b • Trees in one valley were cut down • Sprayed with herbicides
80.0 Deforested 60.0 40.0 20.0 Nitrate concentration in runoff (mg/L) Completion of tree cutting 4.0 Control 3.0 2.0 1.0 0 1967 1965 1966 1968 (c) The concentration of nitrate in runoff from the deforested watershed was 60 times greater than in a control (unlogged) watershed. Figure 54.19c • Net losses of water and minerals • Were found to be greater in disturbed area
We are disrupting chemical cycles throughout the biosphere • With human population increase • Our activities disrupted trophic structure, energy flow, and chemical cycling of ecosystems in most parts of the world