Download
1 / 1
10 likes | 141 Views
His. Tyr. PRPP. Ribose 5P. G6P. Phe. aroge- nate. E4P. 3PGA. Trp. indole. choris- mate. DAHP. PEP. Ser. Leu. Ala. Val. Gly. KIV. PV. Ile. KMV. KB. Cys. Thr. Arg. Lys. arginino succinate. Glu. Gln. Asp. Met. OAA. KG. cysta- thionine. OPH. Asp- semiald.

E N D
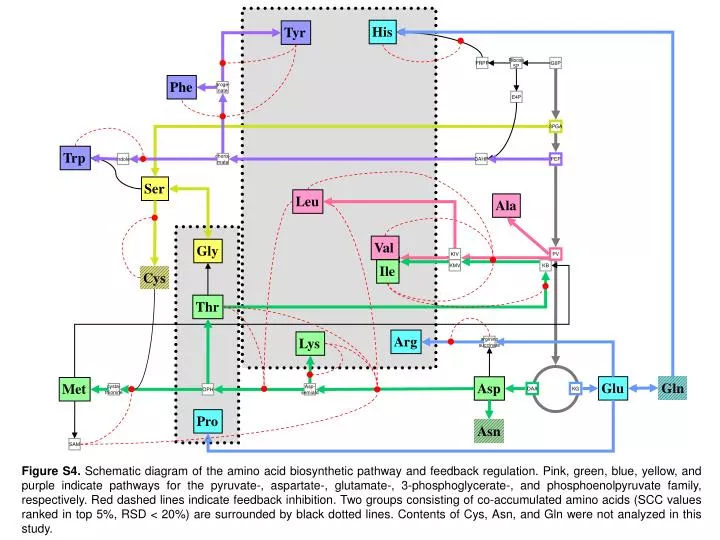
His Tyr PRPP Ribose 5P G6P Phe aroge- nate E4P 3PGA Trp indole choris- mate DAHP PEP Ser Leu Ala Val Gly KIV PV Ile KMV KB Cys Thr Arg Lys arginino succinate Glu Gln Asp Met OAA KG cysta- thionine OPH Asp- semiald Pro Asn SAM Figure S4. Schematic diagram of the amino acid biosynthetic pathway and feedback regulation. Pink, green, blue, yellow, and purple indicate pathways for the pyruvate-, aspartate-, glutamate-, 3-phosphoglycerate-, and phosphoenolpyruvate family, respectively. Red dashed lines indicate feedback inhibition. Two groups consisting of co-accumulated amino acids (SCC values ranked in top 5%, RSD < 20%) are surrounded by black dotted lines. Contents of Cys, Asn, and Gln were not analyzed in this study.