Download
1 / 60
620 likes | 794 Views
Geomatics Synthesis Project. Final presentation November 24 th 2010. Supervisors: Edward Verbree, Cristiaan Tiberius, Ben Gorte, Sisi Zlatanova. Group members: Ye, Daniel, Martin, Marjolein, Bas, Simeon, Hoe-Ming, Sonia, Stratos, Amir, YiJing, Tom. Who are we and why are we here?.

E N D
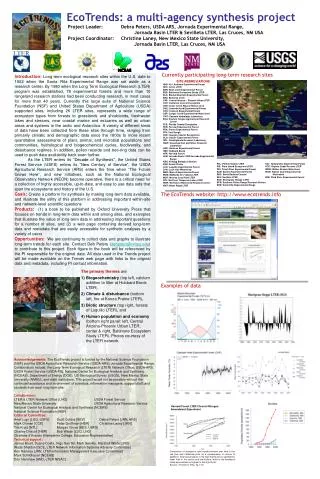
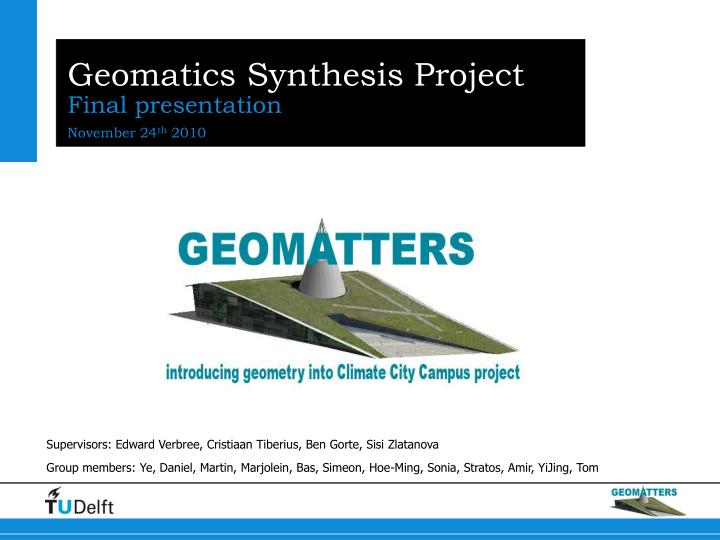
Geomatics Synthesis Project Final presentation November 24th 2010 Supervisors: Edward Verbree, Cristiaan Tiberius, Ben Gorte, Sisi Zlatanova Group members: Ye, Daniel, Martin, Marjolein, Bas, Simeon, Hoe-Ming, Sonia, Stratos, Amir, YiJing, Tom
Synthesis Project Definition Dedicated to the Climate City Campus (http://www.tudelft.nl/live/pagina.jsp?id=d278c89d-70ee-4257-9824-0bcf0cac34bf&lang=en) “Make TU Delft a showcase for multidisciplinary climate research” The Geomatics Synthesis project Our goal: Help building a fundamental framework which will support multidisciplinary climate research in the campus. Our objectives: “Provide the tools to measure and model the climate in the campus“
Overview • Urban Climate research • The tools to do research on Campus Climate • Showcases • Building a spatial-temporal sensor system • Building a 3D environment for climate research • Conclusions and future work
Climate Climate is what you expect, weather is what you get!
Urban Climate What is (urban) climate? Depends on: • size • location • activities • stage of development • … Example: the energy balance depends on changes of chemical content of the area, CO2 emmision of cars, changes reflection (energy fluxes) of landcover, etc.
Climate parameters Static Surface properties Buildings Vegetation Water bodies Roof types Building facade Dynamic • Temperature • Wind • Precipitation • Ground Absorption • Air humidity • Air pollution • Soil Contamination • Energy Consumption • People behaviour
The tools for climate research a centralized information system able to store and manage the sensed climate data along with 3D representations of the built environment a method is developed which enables seamless (anytime, anywhere) measurement of urban climate parameters
The tools for climate research Static climate parameters by modeling city objects and their properties Dynamic climate parameters measured by sensors Spatial Database Get data by query Spatial Database
Show cases Urban Planning • Research Techniques: • Continuous tracking with Wi-Fi & GPS platform (picture) • Temperature/Heat flux sensors (on platform) (Stored in database)
Show cases Wind simulation • Research question: • The effect of EWI building on wind pattern in a specific area • The contribution of trees’ to Wind pattern in our campus • Valuable data for research: • 3D geometric surface representations of buildings • 3D geometric surface representations of trees • Ability to extract certain buildings only • Surface attributes • Drag coefficient of canopy (winter and summer)
I want to know how trees around OTB effect Wind pattern 1st: OTB with Trees 2nd: OTB without Trees
I want to know how leaves matters ID:12021 NAME: Chestnut SPECIES:Castanea_Sativa HEIGHT: 3.15 NDVI:0.27986900000 GEOMETRY: SDO_GEOM LATIN NAME: Castanea_Sativa ENGLISH NAME: Sweet Chestnut DUTCH NAME: Tamme kastanje PAI: 2.92 WAI: 0.32WAI/PAI: 0.11 Compress: 1.6 Drag CW: 0.2 1st: Trees in Summer 2nd: Trees in Winter
Show cases Urban Heat Island • Research question: • The contribution of green areas and water in our campus. • Valuable data for research: • Grass areas • Water areas • Green roofs (area of flat roofs)
How grass/water areas matters? Grass areas, waters and buildings
If I want to have green roofs? Flat roofs
Building a spatio-temporal aware sensor network Enable seamless (anytime, anywhere) measurement of urban climate parameters in the university campus
Sensing requirements MoSCoW diagram
Sensor network Sensors for climate research • Stationary and moving platforms • Thermometers • Barometers • Hygrometers • Anemometers and wind vanes • Rain gauges • Disdrometers • Pollution sensors • Human tracking
Positioning systems Positioning techniques Wi-Fi INS Bluetooth IR UWB HSGPS A-GPS RFID Ultrasonic IMES GPS GSM Pseudolites
Positioning systems • GPS and INS reliable for short time periods, errors with accumulation characteristics • GPS and GSM continuous tracking dependent on the cell tower density and distance to the devices • GPS and IR unique IR and then high accuracy, limited range of IR, sensitivity to sunlight • GPS and Wi-Fi densely deployed access points, ubiquitous hardware with Wi-Fi enabled mobile devices, multipath, signal attenuation due to propagation, NLOS • GPS and Bluetooth like Wi-Fi, limited range and communication speed Positioning technique trade-off
Positioning systems Positioning techniques combination Wi-Fi INS Bluetooth IR UWB HSGPS A-GPS RFID Ultrasonic IMES GPS GSM Pseudolites
Positioning systems Limitations- GPS blind spots in the campus Survey with a U-blox GPS receiver
Positioning systems Limitations- GPS blind spots
Positioning systems Limitations- GPS blind spot map GPS line-of-sight in OTB GPS availability in OTB
Positioning systems Limitations- Wi-Fi blind spots in the campus
Implementation Accuracy table OTB survey
Implementation Continuous tracking • Testing usability of available GPS receivers • Garmin 76CSx • U-blox AEK-4t • Surveying WiFi network • Cisco Aironet Access Points • Cisco Wireless LAN Controllers
Implementation CombinationAlgorithm
Implementation Sensors • Arduino open-source electronics prototyping platform • Low voltage temperature sensor • Python to read the measurement from the Arduino
Conclusions Advantages • Positioning where no GPS is available due to WiFi positioning • Easy to extend WiFi positioning to indoor environments • No location knowledge of Access Points needed • Continuously track sensors within an urban environment • Other sensors can be used in combination with the Arduino • Digital • Analog • GPS shield is available for the Arduino
Conclusions Disadvantages • WiFi fingerprinting within the TU Delft campus • Not enough coverage of Access Points for positioning • WiFi blind spots • Low accuracy • Access Points are placed in a line, zigzag preferred • Transmit Power Control • Client sends collected fingerprints over the WiFi network • When Access Points are discovered but no data connection is available the fingerprint is discarded
Conclusions Disadvantages • Synchronization of devices is difficult • All components write their data into a data stream so the python code has to poll this stream to acquire the data • WiFi fingerprint has to be sent to the Positioning Engine, matched and the location streamed back
Building a 3D environment for urban climate research a centralized information system able to store and manage the sensed climate data along with 3D representations of the built environment
Sensing requirements MoSCoW diagram
Needed objects • Front wall: concrete Which objects to model? • Roof: grass • Building • Side wall: glass • Sensor: Climatic measurements (temperature, humidity, wind flow, rainfall etc.) • Tree • Landuse • Terrain
Literature study How to model these objects and attributes? • DXF: • No Thematic and topology attributes • SHP: • Only simple features and no topology • VRML: • No Thematic attributes • KML: • No Thematic attributes • CityGML: • Geometric and thematic model • Texture surface and appearance • Multiple Level Of Details for building, trees and terrain • Time measurement
Literature study Why database? • File based: • Hard to extract info • Hard to access by different users • Hard to extend • Advantages of Oracle Spatial Database: • Easy access via different software for different user • Make query of objects and attributes • Easy extension of attributes and objects (add column/table) • Spatial analysis and selection in 3D
Implementation Land Use • Processing & Storage Water body Topographic data Land use Roads 2D polygons Buildings Grassland • We can… • Calculate percentage of area of each land cover type within the campus. • Calculate how much area of water is within 10 meters distance of OTB. • etc…
Implementation Buildings • Processing & Storage Existing CityGML model 3D Multi-surfaces • We can… • Get a campus without EWI building. • Retrieve the reflectivity of roof of Civil Engineering • etc…
Implementation Sensors • Processing & Storage • We can… • Find the hottest/coldest hour of a day in a certain location. • Compare same measurement from different times. Measurements (location, temperature, time) 3D points
Implementation Digital Terrain Model • Storage • We can… • Find the most fluctuated ground in the campus. • Find the lower ground where water may flow to after rainfall. • etc. Triangulated point cloud 3D surfaces
Implementation Trees • Storage • We can… • Get the height and species of trees. • Give trees with seasonal parameters. Tree surface Point Cloud 3D multiple-surface Tree parameters
Literature study Trees & Climate Why include trees? • Trees are important in urban heat mitigation strategies: • Create shade • Reduce windspeed • Cool the environment (evapotranspiration) Logo of trees for cities
Literature study • So which tree parameters are useful for climate research? • Geometry • Size, shape, volume area are related to other climate parameters. • Shade and wind analysis. • Drag Coefficient • Necessary for wind analysis. • Leaf Area Index • LAI is used to predict photosynthetic primary production and as a reference tool for crop growth. • Normalized Difference Vegetation Index • NDVI is directly related to the photosynthetic capacity and hence energy absorption of plant canopies. Trees & Climate
Implementation Outer hull reconstruction for LOD2
Implementation LOD1 and LOD2
Implementation of LAI Leaf Area Index • Determine the size of the footprint from the acquisition system: • ALS (FLIMAP) • Calculated the probability echo returns from a tree branch