Download
1 / 16
170 likes | 277 Views
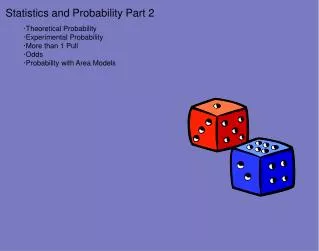
Statistics and Probability Part 1. · Scatter Plots ·Correlations ·Outliers ·Mean, Median, Mode ·Matrixes . Scatter Plots. Using the definition, which graph is a scatter plot?. B. A. Scatter plots are just 'x' and 'y' points on one graph. The individual points are NOT connected.

E N D
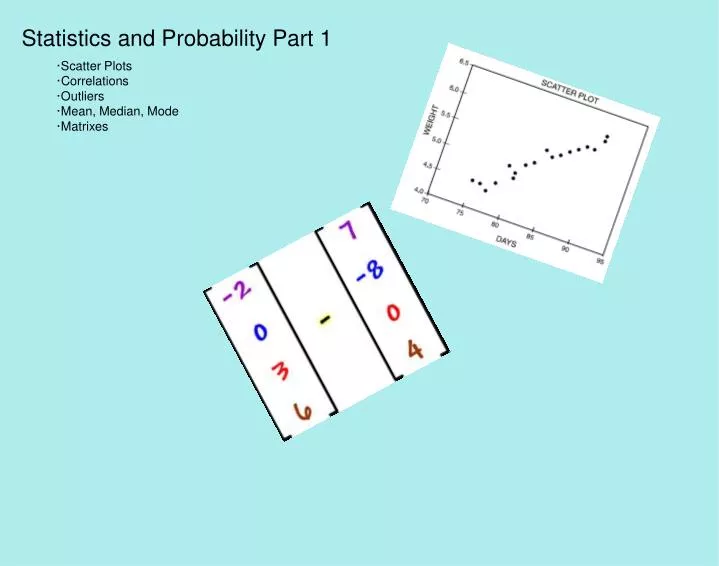
Statistics and Probability Part 1 ·Scatter Plots ·Correlations ·Outliers ·Mean, Median, Mode ·Matrixes
Using the definition, which graph is a scatter plot? B A Scatter plots are just 'x' and 'y' points on one graph. The individual points are NOT connected.
Make your own scatter plot using the data below. Remember the points on a scatter plot are NOT connected. Height (y) Age (x)
Determining if scatter plots have a relationship (correlation) between the 'x' and 'y' values. Scatter plots have a correlation if the points are close together. Scatter plots have no correlation if the points are far apart. correlation? no correlation? A B
Types of correlation... Strong correlations have points that are closer together. Weak correlations have points that are no so close together. Which scatter plot would be the... strongest? weakest? Positive = UP Negative = DOWN A B
Do NOT confuse no correlation with weak correlation. no correlation? weak correlation? B A
Check You Out... Label the correlations with the correct graph. A C D E B no correlation weak negative weak positive strong negative strong positive
Matrixes are just another way to organize data. For example... Data can go from this to this Food Gas Clothes John 25 15 150 James 30 10 275
You read a matrix just like a table. Food Gas Clothes John 25 15 150 James 30 10 275 How much did John spend on Gas? How much did James spend on Food and Gas? How much more did James spend on clothes than John?
Check You Out... February January Food Car Food Home Car Home Ashley 325350400 Dina 325375525 Ashley 340400475 Dina 325225500 How much did Ashley pay for her car in BOTH months? How much did Dina pay for Food in February? How much did Dina pay for Car and Food in January? How much more did Ashley pay for Home in January? How much did Dina spend in February?
An outlier is a number that is drastically different from the all other numbers. Try to find the outlier... 25 27 28 26 28 6 16 17 18 18 2 17
When you have and outlier in data, the mean will not be accurate. Since outliers change the mean, we use the median. * Finding the median when there are two middle numbers you get the _________ of the two middle numbers. 25 27 28 26 28 6 16 17 18 18 2 17 Mean = 23.3 Mean = 14.6 Median = Median =
Check You Out... Find the most reasonable average (mean)? Hint: If there is an outlier, just find the median... 7 8 5 6 8 6 5 6 106 125 117 118 124 120 123 12 13 15 12 16 29 14 14