Download
1 / 1
10 likes | 73 Views
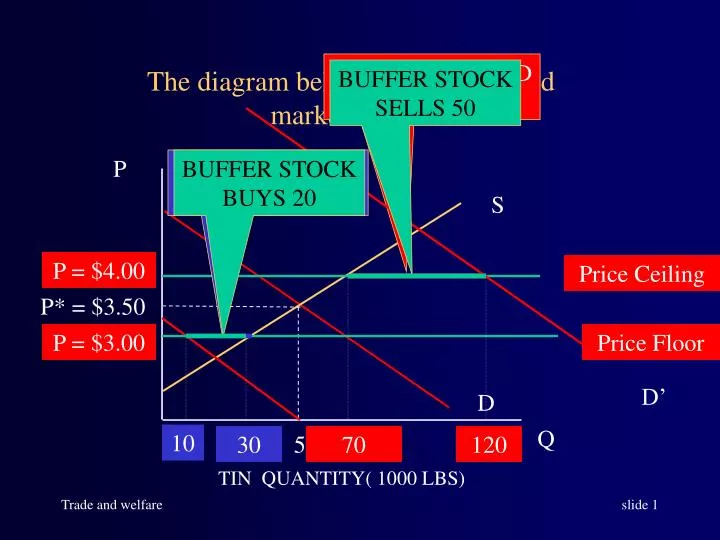
The diagram depicts the world market for tin, detailing excess demand, buffer stock, selling and buying quantities, price ceiling and floor. Analyze the impact of these factors on trade and welfare in the market.

E N D
EXCESS DEMAND 50 BUFFER STOCK SELLS 50 EXCESS SUPPLY 20 BUFFER STOCK BUYS 20 P = $4.00 Price Ceiling P = $3.00 Price Floor D’ 10 30 70 120 The diagram below shows the world market for tin. P S P* = $3.50 D Q 50 TIN QUANTITY( 1000 LBS) Trade and welfare