Download
1 / 18
180 likes | 385 Views
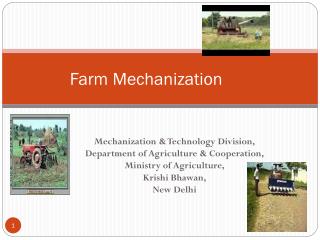
Farm Income & Investment Plans. Liam Connolly Brian Moran Michael Cushion. Farm Income & Investment Plans. OUTLINE Farm Income 2007 Farm Income Estimate 2008 On Farm Investment 2008 Planned Farm Investment 2009. Family Farm Income (FFI) 2001-07. Source: National Farm Survey.

E N D
Farm Income & Investment Plans Liam Connolly Brian Moran Michael Cushion
Farm Income & Investment Plans OUTLINE • Farm Income 2007 • Farm Income Estimate 2008 • On Farm Investment 2008 • Planned Farm Investment 2009
Family Farm Income (FFI) 2001-07 Source: National Farm Survey
Full-time/Part-time Farms 2007 36,400 75,500 Source: National Farm Survey 2007
Family Farm Income 2007 Full-time Farms Source: National Farm Survey 2007
Family Farm Income 2007 Full-time/Part-time Source: National Farm Survey 2007
Output in Agriculture 2008/07 (€m) -4.1% +12.8% +3.2% +9.2% -8.2%
Income in Agriculture 2008 (€m) Source: CSO
Income in Agriculture 2008/07 (€m) +2.9% +10.5% +3.1% -16.1% Source: CSO
Planned Farm Investment 2005/09 Source: National Farm Survey
Planned Farm Investment 2005/09 Source: National Farm Survey
Farm Investment Plans 2009 2009 Change 08/09 Buildings € 155 M 43% - 83 % Machinery € 107 M 29% - 26% Land € 81 M 22% + 138 % MilkQuota € 8 M 2% - 52 % Other € 12 M 3% - 30 % Total € 363 M 100% - 68% Source: National Farm Survey
Investment by Farm System 2009 System €M % Dairying 194 53 % Cattle 110 30 % Sheep 26 7 % Tillage 34 9 % Total 363 100 % Source: National Farm Survey
Farmers Planning Investment 2009 8,400 €13.1K/Farm €30.2K/Farm 6,400 €30.7K/ Farm €13.9K/ Farm 1,800 Source: National Farm Survey 1,100
Actual v Planned Farm Investment 2001-2009 Source: National Farm Survey
Summary • Farm Income Trend: €17K Static • Farm Incomes 2008: Decline of 16.1% • Due to higher costs • Farm Investment • 2008 – Actual € 1.9Billion • 2009 – Planned € 363 Million
Thank – You Papers available from www.tnet.teagasc.ie/rerc