Download
1 / 79
790 likes | 804 Views
This guide provides instructions and rules for completing the T&D benchmark study questionnaire, including data entry and error avoidance. It also outlines the process models and highlights key definitions. Notable changes for 2019 are highlighted, including new sections and rotational surveys.

E N D
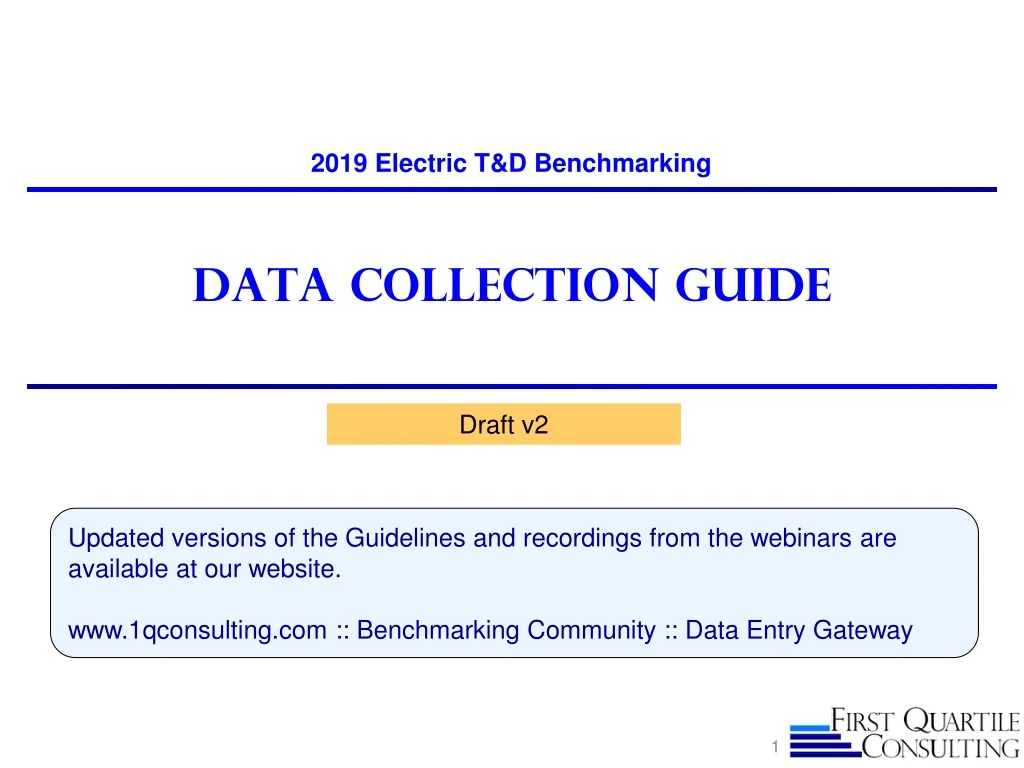
2019 Electric T&D Benchmarking Data Collection guide Draft v2 Updated versions of the Guidelines and recordings from the webinars are available at our website. www.1qconsulting.com :: Benchmarking Community :: Data Entry Gateway
Table of Contents • Page • Reliability 46 • DR. Distribution Reliability 48 • SR. Substation Reliability 51 • TR. Transmission Reliability 53 • SU. Support 56 • SG. Smart Grid 60 • AM. Asset Management 62 • DG. Distributed Generation 64 • CP. Capital Projects 69 • LP./TS. T&D Line and Substation Projects 71 • DP. Distribution Line Practices 73 • SP. Substation Line Practices 75 • TP. Transmission Line Practices 77 Page Introduction 3 Notable Changes for 2019 4 T&D Process Model 5Collection Guide Outline 6 ST. Statistics & Systems Data 9 Financials 16 DF. Distribution Finance TF. Transmission Finance SF. Safety 32 SO. Staffing/Outsourcing 37 ER. Storm Response 41
Introduction • Purpose of this document • The purpose of this Data Collection Guide is to provide guidance and direction in how to complete the detailed questionnaire for the T&D benchmark study. It gives instructions regarding the types of answers expected, as well as errors to avoid. This Guide has been described as the “rules” for providing data. • It provides the underlying process models around which the various sections of the questionnaire are organized, to help in understanding the purpose of some of the questions. • The appropriate costs to include, and those to exclude, are highlighted so that each member utility can provide accurate data that readily supports comparisons. • Some key definitions are provided throughout the document. A comprehensive set of definitions is available in a separate Glossary.
Notable Changes for 2019 • For the 2019 T&D Benchmarking, several changes to note: • Added a new AMI section aimed at gathering AMI financial and organizational information that should be completed once by your organization (this section was sent separately to coordinators. Also we are asking you to coordinate and complete it once in the case your company participates in both T&D and CS surveys with First Quartile). • Several sections have been identified for areas we would like to survey on a rotational basis (not every year). This year we will not survey Shops, Blue Sky Trouble Response. In other sections, such as Distribution, Substation and Transmission Practices, we have rotated-out groups of question for review and inclusion in future years. • Several sections have been focused to capture only a few examples such as for storm data (Storm Response), substation projects (Subs Projects) and line projects (Line Projects)
A Process Model for Managing the T&D Business • The T&D benchmarking survey is built around a process model of the T&D business. This model helps in analysis of the performance and practices of the member utilities, and gives a framework for deeper investigation. Indicates separate D, S, T components Respond to Emergencies Add New Customers Sustain System Expand System Operate System Project/Portfolio Management Develop and Approve Asset Plans Develop System Strategy
Data Collection Guide Outline The purpose of this Data Collection Guide is to describe the “rules” for providing data. The organization is as follows:
GENERAL GUIDELINES • Entering Zero (0) vs. leaving data entry fields blank; for our purposes: • Zeromeans that your data collection effort has determined that the correct value for your company is, in fact, zero. Therefore, we will include your company with a 0.0 value on the reports and in our calculations of mean and quartile values for the community. • Blankmeans that your company’s value is unknown or you did not collect data to respond to the question. Therefore, we will not include your company on our reports nor in our calculations of mean and quartile values for the community. • Allocation questions: • In some areas of the survey, we ask that a number collected in one question be allocated across subcategories in a subsequent question, either numerically or as a percentage of the total in the first question. In most cases, it is intended that the allocations across the listed subcategories total to the number in the first question (or 100%, if % allocations are requested). Please keep this in mind as you develop your data to be entered into the survey. We have built in some automatic edit calculations to catch under- or over allocation errors at the time of data entry.
GENERAL GUIDELINES (CONT.) • Questions that ask for text responses: • Be brief and succinct – so that the reader will not need to read through an extensive volume of material to understand the message • Make your responses anonymous: don't mention your company name or other company identifying information (e.g.. city or state names) in your replies • Avoid use of jargon, acronyms, organizational references, etc., that people outside your company may not understand • For open-ended questions, be complete enough to answer all aspects of the question • Questions that ask about “practices” or “initiatives”; for our purposes: • Practices are activities, programs or processes that have been in place for more than 2 years and have been determined to be effective. We mostly ask about practices that have proven successful in accomplishing a specific goal. • Initiatives are new activities, programs or processes that have been enacted recently (within the past 1 to 2 years) with the goal of improvement. These may not have been in place long enough for you to assess their success, but we are still interested in learning what you are doing to try to improve.
Statistics --Purpose & Structure • Purpose… • The Statistics section is used to gather demographic information used to normalize the data • System configuration • Numbers of system components • Age of parts of the system • It also includes measures of system activity (e.g. growth, etc.), to enable analysis of costs and results of various activities • Last, it includes information about the various IT systems in place to support the T&D operations
Statistics • This section collects the following types of information: • Age profile data for major equipment components • Other electric T&D system demographic data such as end of year customer counts, service territory size, miles of line, numbers of structures, etc. • Data quantifying how much customer and system growth occurred over the past year • Major software packages used for key T&D information systems (e.g., OMS, WMS) Uses of the collected information: • Some of the end of year data is used to normalize the cost, reliability and staffing data that is collected elsewhere in the questionnaire • Other data is used in unit cost calculations or statistical analyses of results to better understand the inherent advantages and limitations of circumstances facing each utility.
Transmission versus Distribution Transmission classes >=45kV (Phase to Phase) • <69kV class (>=45kV <69kV) • 69kV class (>=69kV <100kV) • 100kV class (>=100kV <200kV) • 200kV Class (>=200kV <300kV) • 300kV Class (>=300 kV <400 kV) • 400kV and above • For purposes of this survey, we define distribution to be a voltage level of 44kV and below. The distinction is somewhat arbitrary, but picks a point between 69kV, which is generally considered a transmission (or at least sub-transmission) level, and 21kV, which would generally be considered distribution. • In some cases, it may be unrealistic for utilities to redefine all of their internal statistics, cost and reliability reporting on the basis of these definitions. In such case, we accept data collected based on a utility’s self-determined definitions. However, a utility that has very different definitions and performance results may want to take the time to restate their data to better compare their performance. • Distribution Voltage Classes • (Phase to Phase • 5kV class (>1kV, <=9kV) • 15kV class (>9kV, <=15kV) • 25kV class (>15kV to <=26kV) • 35kV class (>26kV to <=36kV) • 44kV class (>36kV to <=44kV)
Substation statistics Transmission Classes >=45kV (Phase to Phase) • <69kV class (>=45kV <69kV) • 69kV class (>=69kV <100kV) • 100kV class (>=100kV <200kV) • 200kV Class (>=200kV <300kV) • 300kV Class (>=300 kV <400 kV) • 400kV and above Note: We will have transmission-only and distribution-only entities participating in this survey. Their voltage levels will not necessarily line up with the above definitions. • For purposes of this survey, we classify all stations that have 44kV or below low-side voltage as distribution substations: • In some cases, it may be unrealistic for utilities to redefine their internal substation statistics, cost and reliability reporting on the basis of these definitions. In such case, we will rely on each utility’s self-assigned definitions. However, a utility that has very different definitions and cost or reliability results may want to take the time to restate their data to better compare their performance. • How to handle multi-purpose substations: • For multi-purpose substations, you may either assign all costs and MVA based upon the substation’s predominant function or segregate costs and MVA to portions of the substation that are transmission vs. distribution (the second approach is preferred) • Distribution Voltage Classes • (Phase to Phase) • 5kV class (>1kV, <=9kV) • 15kV class (>9kV, <=15kV) • 25kV class (>15kV to <=26kV) • 35kV class (>26kV to <=36kV) • 44kV class (>36kV to <=44kV)
Substation statistics (cont.) • Because our benchmarking is done at a relatively high level, we want to include transmission substations that have auto-transformers, but not any AC/DC converter stations. • While the way that MVA capacities are measured for auto-transformers versus power transformers differ, and the resultant capacity ratings are not truly comparable, we want to recognize the existence of transmission substations that have auto-transformers to make high level comparisons of cost and reliability performance. • Customer-owned substations are sometimes an issue in making comparisons: • If customers own, operate and maintain the substations that serve them, the reporting expectations for this survey are clear – you should exclude all data (statistical counts, costs and reliability) for the customer-owned substations • In the event that you operate and/or maintain customer-owned substations, you may need to make some adjustments to your internal data to support valid comparisons with other companies. The preferred approach is to exclude both the statistical data (counts, MVA capacity, etc.) and O&M costs of all customer-owned substations. However, if you cannot practically exclude the O&M costs from your internal data, you should include the customer-owned stations when compiling your statistical data for our survey • Small, pole-mounted or pad-mounted “mini-substations” (e.g., step-down transformers on distribution circuits with protective devices and a disconnect switch) should not be counted as distribution substations.
Substation STATISTICS (Cont.) • We want to compare substation capacity and costs based on transformer MVA ratings at normal operating conditions: • Since utilities have different “normal” operating conditions and manufacturers calculate their ratings in different ways, we will rely on each utility to report their MVA ratings based on their own definitions. U.S. utilities should use the number that they report on FERC Form 1. • We recognize that operating conditions for auto-transformers differ from those of power transformers so comparisons of “normal” capacity are imprecise. However, we think that including them in in the overall capacity statistics for transmission substations is a better solution than leaving them out entirely.
Financial sections Overview • The Financial sections of the questionnaire (Sections DF and TF) ask for the Capital and O&M costs of running the business, separated between Distribution Lines, Distribution Substations, Transmission Lines and Transmission Substations • We use two cost reporting models: • FERC: The overall cost model is based on the FERC system of accounts, with a number of adjustments designed to make the cost reporting more consistent between the companies. Specific questions within the questionnaire ask for the data reported in a group of FERC accounts, and then subsequent questions ask for the information required to make the desired adjustments. • ACTIVITY-BASED: The guiding principle of the activity cost model is to capture the expenditures associated with the year in which they were made, regardless of when they were actually reported to FERC. The activities also are more aligned with typical budgetary categories, such as New Business (capital) and Vegetation Management (O&M). While budget categories differ among utilities, we have developed a set of budget categories that most companies have been able to use. • The Financial section also covers assets, depreciation and Construction Work In Progress (CWIP)
FERC: The ADJUSTED FERC COST MODEL • Certain costs are excluded to provide fair comparisons that focus on operations (see next pages) Substations • Substation costs need to be allocated from Transmission and Distribution accounts
FERC Cost Exclusions: general • The goal of the exclusions is to provide a fairer comparison of T&D operational performance, by excluding certain costs which are included in FERC reporting that are not under the control of T&D management. • A&G Costs: exclude costs typically reported as A&G (e.g. pensions and benefits) from your FERC O&M data. Also exclude any corporate A&G overheads that may be charged to your FERC O&M • General Plant Costs: exclude costs typically reported as General Plant (e.g. IT/Communications infrastructure, capital cost of buildings) from your FERC Capital data. • Land Acquisition Costs and Building Rents/Leases: Land acquisition costs should be excluded from your FERC Capital data because they vary greatly by region and also can occur at very different points in time, based upon land policies. Building rents/leases should also be excluded from FERC O&M data for similar reasons • Extraordinary Items Including Major Storm Events: You should exclude the costs of any very large, unforeseen event or transaction for which the total O&M or total Capital spending exceeded 10% of your company’s annual T&D O&M or Capital spending. • Note: For major storm events, some utilities use an “insurance reserve” account. The restoration expenses for major storms are charged to the reserve account and are not reported as O&M expenses. If you had a major storm event and your company uses such an account, you do not need to make any adjustment to your FERC O&M data. However, you should still adjust your FERC capital data to remove any capital expenditures for major storm events that exceeded the 10% of annual budget threshold.
FERC Cost Exclusions: specific • Distribution • Exclude all street lighting capital and O&M costs. There is a large variation in what street lighting exists in utility service territories and what percent is owned and operated by the utility versus other entities (e.g., municipalities) • Substation • Exclude any O&M expenses for which you are reimbursed, such as substation maintenance work performed for customer-owned substations. • Transmission • Exclude wheeling expenses: Our transmission cost metrics are geared to operational performance of the infrastructure. So, while an argument could be made that wheeling is a substitute for system ownership, it may also be simply an economic arrangement to purchase incremental or low-cost power. • Exclude Regional Transmission Operator fees: These costs vary between regions and many utilities don’t even incur these costs, so they should be excluded.
FERC: T&D Capital Adjustments • Each portion of the financial section asks for the key FERC accounts, and then asks for the information necessary to make the adjustments. • Since FERC doesn’t capture Substations as a separate area, the blue arrow in the figure below highlights how to move the FERC T or D cost to Substations. • Note: All reported FERC costs are net of Contributions in Aid of Construction (CIAC).
FERC: T&D O&M Adjustments • For O&M expenses, the Substations expenses also need to be removed from the overall FERC expenses (as shown with the blue arrow). Other individual exclusions are identified as well.
Activity-Based Cost Model • Transmission Line Capital • Serve New • Expand • Sustain • Other • CIAC • T&D Substation Capital • Serve New • Expand • Sustain • Other • CIAC • Distribution Line Capital • Serve New • Expand • Sustain • Meter & Transformer Purchases • Other • CIAC • Transmission Line O&M • Sustain • Operate • Other • T&D Substation O&M • Sustain • Operate • Other • Distribution Line O&M • Sustain • Operate • Other Our activity-based cost model breaks annual expenditures into capital and O&M, and then splits them into the activities shown on the process model introduced previously in these guidelines. The following pages describe the key differences between the Activity Based and Adjusted FERC cost models and provide more detail on the individual activities being tracked for Transmission, Substations, and Distribution.
ACTIVITY-BASED Cost Model: Capital • Our Activity-Based Capital Cost model addresses several important shortcomings in FERC capital accounting: • Under FERC capital accounting, the dollars expended for large projects go into a Construction Work in Progress (CWIP) account and are not transferred to FERC plant accounts until the assets are placed into service, sometimes a several year lag. • FERC capital expenditure accounts generally follow units of property (e.g. poles, towers, and fixtures) rather than the typical reasons why utilities spend capital (e.g., for new business, capacity expansion, system improvement) • For these reasons, a simplified Activity-Based Costing system was developed to obtain an allocation of current year actual capital spending by process • Reconciling the Activity-Based and FERC Capital Totals: • Due to the use of CWIP accounts in FERC reporting, total Activity-Based capital for a given company does not typically match their reported “adjusted FERC capital” for the year. When you compare the two totals, the total Activity-Based capital for a given year should be roughly equal to your total reported adjusted FERC Capital plus the net change in FERC CWIP account totals that occurred from year-end of the prior year to year-end of the reporting year (we say “roughly”, because we have not asked that the CWIP year-end totals be adjusted for any of the FERC capital exclusion items referenced previously).
ACTIVITY BASED CAPITAL COSTS – CIAC REPORTING This should be spending net of CIAC This should be a positive number – the amount given as CIAC 1QC to do analysis with and without CIAC DF50, DF55, TF45, TF50: the main set of answers for capital additions should be net of CIAC. Then the CIAC row should be a positive number and should be the total CIAC for all categories of work. Example:
Activity-based Capital – PROJECT classifications One question that we field regularly is which Activity-Based Cost category should be used when companies are increasing line and/or station capacity and also replacing/improving facilities on the same project. We do not expect companies to split the costs of individual projects across multiple Activity-Based Cost categories. Instead, we ask that projects be classified based on their primary purpose. The first determination to be made is whether a project’s primary purpose is “providing new or increased capacity” or “replacing and/or improving reliability of existing facilities”. Once that determination has been made, the project should then be further analyzed to determine which of the subcategories of “New/Increased Capacity” or “Replace/Improve” best describe the primary purpose of the project. All of the project spending should then be recorded in that subcategory.
ACTIVITY-BASED Cost Model: O&M While FERC O&M accounts tend to be more activity-oriented, they still do have some limitations for inter-utility benchmarking: • FERC O&M accounts do not segregate the costs of some important work processes such as vegetation management and service restoration • Therefore, our Activity-Based O&M Cost Model asks companies to segregate total adjusted FERC O&M costs into key process areas Reconciliation of Activity-Based and FERC O&M Totals • Your total reported Activity-Based O&M expenses should always match the total of what you reported as “Adjusted FERC O&M”
Activity Based Costs – Distribution Lines Capital Expenditures O&M Expenses
Activity Based Costs – T&D Substations Capital Expenditures O&M Expenses
Activity-Based Costs: Transmission Lines Capital Expenditures O&M Expenses
Assets, Depreciation, CWIP The last series of questions in the DF and TF sections collect plant in service (asset base), depreciation and CWIP values as reported to FERC. The plant in service data is used as a normalizing factor for current year cost data. Depreciation data is used to analyze asset replacement rates and the CWIP data is used to validate reported differences between FERC Capital and Activity-Based Capital spending.
Safety- Purpose and Structure • Purpose… • The purpose of this section is to capture safety performance measures and understand the practices that drive good performance or influence poor performance. • What’s included or excluded… • All T&D field and office occupations should be included in the safety stats (all company employees counted in the Staffing section). • Meter Readers and Field Service staff should not be included in the safety stats. • Sections include: • Safety Metrics • Motor Vehicle Safety Initiatives and Practices • Leadership and Organizational Structure • Responsibility and Accountability • Leading Indicators • Awards/Recognition • Incident Reporting • Wellness, Formal Safety Observations, Communications, Public Safety
Safety Reporting • The employee injury statistics come directly from OSHA definitions (see www. OSHA.gov) • Motor vehicle accident data are also requested (total counts and segregated counts for preventable and high risk accidents) along with miles driven • However, there are some safety reporting differences among companies which should be recognized when analyzing comparative data: • Vehicle accident data – Some utilities do not collect data on preventable and/or high risk accidents, so they only report the total counts. • Vehicle accident data – We want companies to include personal vehicles when used for company business. Some companies are not able to do that. • Employee injury data -There are some differences in how utilities administer limited (or light) duty work, which will not be resolved as part of this benchmarking.
Where the Data comes from All of the employee injury data comes from the OSHA form. We need total hours worked by all employees (including OT) for normalization and the total numbers of each type of case, as well as the days away and days restricted totals.
Safety Question We’re asking for raw data directly from your OSHA form for the employee injury stats. Within the question we calculate the safety rates that we’ll be using in the performance profiles and in the report.
Staffing- Purpose & Structure • Purpose… • To gather staffing data grouped by functional area and by Distribution, Substations, and Transmission in the form of FTEs (Full Time Equivalents) • To collect supporting data that can be helpful in understanding staffing such as overtime, wage rates, and contracting/outsourcing • To understand several practices in the areas of employee engagement, training, recruiting, and mentoring • What’s sections are included .. • Average Wage Rate • Staffing (D-Lines, Subs and T-Lines) • Staffing Practices (including Overtime, Attrition, Tenure, Shift Duration) • Outsourcing
Staffing • Staffing FTEs: • Count all company employees assigned full time to a function, including direct labor, supervision, administrative support and technical support • Also count contract employees who work in company offices and/or on company facilities and who are directly supervised by company employees (see Glossary definition for “Contract FTE”) • Add in partial counts for part-time employees (seasonal employees or employees who work less than 40 hours per week) and for full-time employees who split their time across different functions • When calculating FTE value use 2080 hours per year as the denominator. • When counting FTEs we don’t expect companies to get total number of employee hours and divide that by 2080. We do expect companies to look at changes in head count throughout the year and use that information to adjust final (or year-end) headcount to get an estimate of actual FTEs. So, a person working fulltime for ½ of the year is only ½ of an FTE. A person working 20 hours per week for the full year is also ½ of an FTE.
STAFFING • 50% guideline: Include a person in a function if they spend at least 50% of their time in that function. If a person divides their time so that they don't spend 50% on any single function, count them in the “Other” category. • For SO12, if you cannot split your Field Maintenance and Field Construction staff, enter the data under Field Construction • FTEs to exclude from staffing (SO12, SO15, SO20, SO25): • Storeroom/Warehouse • Fleet • Land Management • Street Light Maintenance (street light costs are excluded) • Environmental • Combined electric and gas distribution companies should prorate staffing in any of the functional areas that support both electric and gas so that the gas portion is excluded from all four of the FTE count questions. • As always, we encourage you to check your responses, not only for staffing but for all topics, to ensure that you have not double counted the data for your company. That is, for staffing where we are asking for exclusions, you should make sure that the total for the company (survey response plus the exclusions) is 100%.
Storm Response---purpose and Structure • To better understand storm responses, this section collects the following storm statistics: • For storm events that were experienced last year (2018) where the cumulative number of sustained customer interruptions during the event exceeded 1% of your total customer base. : • Count of storm events by size range • Average Storm CAIDI for events in each size range • For Major and Catastrophic Storms, more detailed information on individual storms experienced last year which fell into either the "Major" (>10% to 20% of total customers interrupted) or "Catastrophic" (>20% of customers interrupted) size categories. • Please identify these storms by answering questions ER20 through ER30 for the two largest storm events that your company experienced last year where total sustained customer interruptions exceeded 10% of your customer base. • In addition we ask several questions about company storm response operations including questions about roles, personnel, exercises, damage assessments and any changes you are experiencing in the severity of events
Supplemental Tab For Major and Catastrophic storm Detail • Additional data reported on ER Supplemental tab: • Use this supplemental questionnaire to furnish hour-by-hour customers out and hour- by-hour customers restored data for the major and/or catastrophic storms identified in question ER20 of the main T&D Questionnaire. (See the main Glossary for definitions of data fields) • Instructions: • All data entry should be done on the ER Supplemental tab in the Excel file • The data and charts on the "Storm 1” and "Storm 2" tabs are generated automatically from the data entered in questions ER85 and ER90 in this supplemental tab. Please answer questions ER85 and ER90 for last year's major and/or catastrophic storms that were identified in your answer to question ER20. • (Major and Catastrophic storms information: We are seeking more detailed information on individual storms that you experienced last year which fell into either the "Major" (>10% to 20% of total customers interrupted) or "Catastrophic (>20% of customers interrupted) size categories) • After entering data, check the protected sheets labeled “Storm 1” and “Storm 2” to verify that that the entered data produced a logical set of restoration curves (see example on next page)
Storm Response (Continued) Example Restoration Curves Calculated Values (Accumulated ER90 responses + ER85 responses) Accumulated ER90 responses ER85 responses (Time line was manually adjusted so that Hour 0 = Hour of Peak Customers Out)
Storm response – how data is used The detailed storm data collected through this section of the survey are being populated into a 1QC database which is being used to produce various comparisons and statistical analyses that allow companies to benchmark their storm restoration effectiveness against other companies. Here are examples of analyses presented at previous Insights Conferences: Restoration Curve Comparisons Correlation Analysis
Reliability Distribution, Substation, and Transmission
Response formatting for Reliability:Zero vs Blank For all of the reliability sections, we do want you to report zeros where you experienced no outages. Distribution: For distribution if you are completing a questions DR30, DR35, DR40, DR45 and did not experience outages by one of the causes, you should enter a zero. Other questions where zero may be appropriate are DR65, DR80, DR95. Substations: For questions SR10 to SR25, if you experienced no failures, mis-operations or outages by a specific cause you can enter zero. Transmission: For the outage questions, only report zeros for voltage levels that you have. So if you had no outages caused by vandalism, you would still only enter zeros for the voltage levels that you have. If you have no 600kV, you would leave that blank.
Distribution Reliability- Purpose and Structure • The purpose of this section is to identify the reliability levels, measurement practices, and initiatives underway to improve distribution reliability. • The perspective is from the end-user, so interruptions from distribution, transmission, substation, and generation are included. • NOTE: The structure of this section includes asking for your reliability statistics. Questions about the Estimated Restoration Times (ERTs) are also included here because of impact on reliability
Distribution Reliability Statistics • The various distribution customer reliability statistics that we collect in this section are defined in IEEE Standard 1366. The latest edition of that standard (IEEE 1366-2012) can be purchased for download at: http://standards.ieee.org/findstds/standard/1366-2012.html • Some of the key reporting issues addressed by the IEEE standard include: • Outage duration to be considered a sustained interruption • Definition of a major event (2.5 Beta Method) • Utilities vary in exactly how they apply the IEEE standard and there are some differences among utilities on data collection system parameters that are not resolved in the standard such as: • Step restoration reporting • Level of reporting (e.g., are single service outages included) • Accuracy of reported restoration times • In addition to all of the IEEE 1366-defined reliability statistics, we calculate and compare “mileage normalized” customer interruptions and customer interruption durations.
Distribution Reliability Statistics (cont.) • In this section, we also collect some practice information in the following areas: • Estimated Restoration Times • Customer research shows ERT’s are very important and that most utilities are providing them under normal circumstances; please provide information on your practices for ERTs, both under normal conditions and in storm situations. • Blue Sky Day Trouble Call Response • We ask about staffing allocated to first response to customer trouble calls and the average time it takes to dispatch, travel to site and complete repairs/restoration on “blue sky days” (days when less than 1% of customers are out and no significant storms are expected)