Download
1 / 5
50 likes | 63 Views
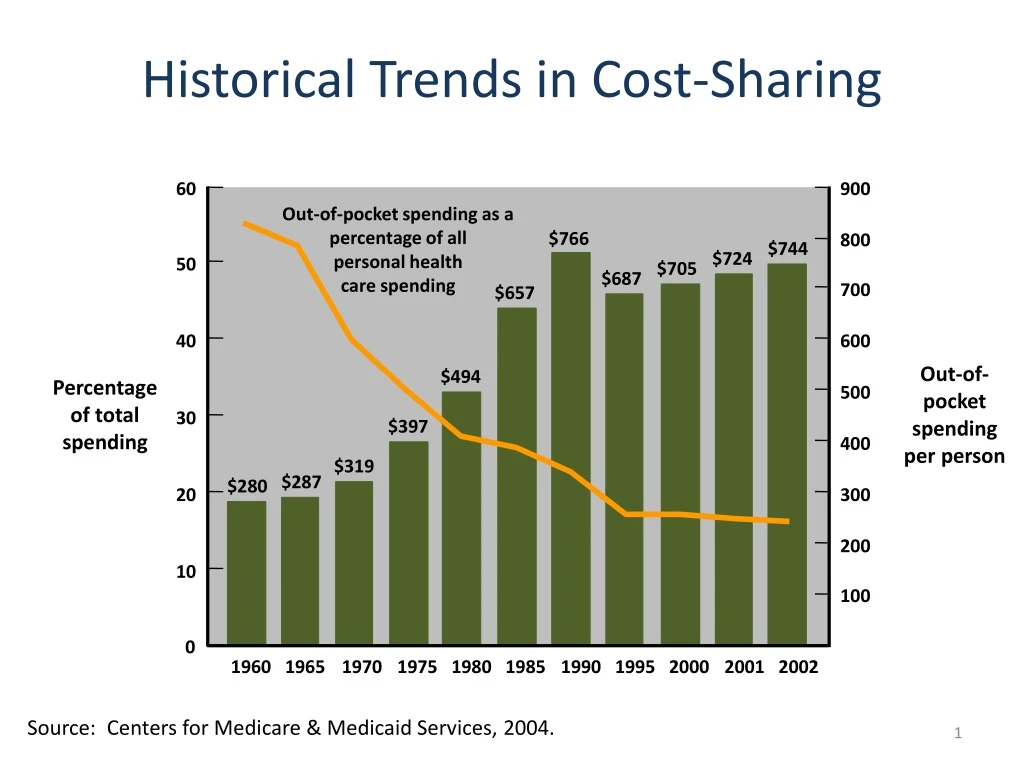
900. $766. 800. $744. $724. $705. $687. 700. $657. 600. Out-of-pocket spending per person. $494. 500. $397. 400. $319. $287. $280. 300. 200. 100. 0. Historical Trends in Cost-Sharing. 60. Out-of-pocket spending as a percentage of all personal health care spending. 50. 40.

E N D
900 $766 800 $744 $724 $705 $687 700 $657 600 Out-of-pocket spending per person $494 500 $397 400 $319 $287 $280 300 200 100 0 Historical Trends in Cost-Sharing 60 Out-of-pocket spending as a percentage of all personal healthcare spending 50 40 Percentage of total spending 30 20 10 0 1960 1965 1970 1975 1980 1985 1990 1995 2000 2001 2002 Source: Centers for Medicare & Medicaid Services, 2004.
What Explains the Increase in Total Medical Spending over the Last Fifty Years? Aging Technology Income Insurance Prices
Features of risks that should be insured • Unlikely • Expensive • Uncertain • Use is not sensitive to insurance (inelastic demand)
Why do we have health insurance? • Insurance against financial loss • Transfer money to people who are sick • Tool for population health?
So how does cost-sharing line up with our insurance goals? • Example 1: Traditional oral agents like anti-hypertensive drugs • Not rare • Not expensive • Not uncertain • Not a good candidate for insurance • Now covered generously • Example 2: Specialty drugs like Avastin for metastatic cancer • Rare • Expensive • Uncertain • Trend is to require extreme cost-sharing to pass risk back onto patients