Download
1 / 41
410 likes | 419 Views
This article explores various figures and tables illustrating the economic service life calculations, replacement decision frameworks, and cash flow analysis for asset disposal and replacement decisions.

E N D
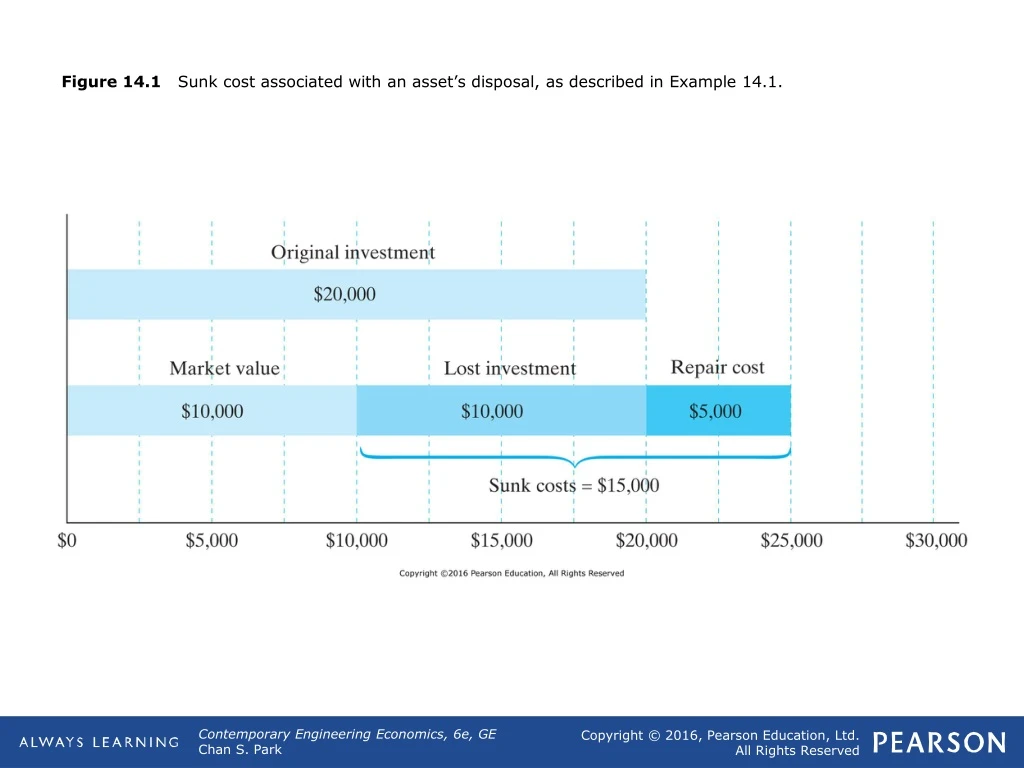
Figure 14.1 Sunk cost associated with an asset’s disposal, as described in Example 14.1.
Figure 14.2 Comparison of defender and challenger based on the opportunity cost approach (Example 14.2).
Figure 14.3 A schematic illustrating the trends of capital recovery cost (ownership cost), annual operating cost, and total annual equivalent cost.
Figure 14.4 Annual equivalent cost (AEC) for owning and operating the asset for two years.
Table 14.1 Economic Service Life Calculations for a Lift Truck
Figure 14.5 Conversion of an infinite number of replacement cycles to infinite AE cost streams (Example 14.3).
Figure 14.7 Types of typical replacement decision frameworks.
Figure 14.8 Overall replacement strategies under an infinite planning horizon.
Table 14.2 Economic Service Life Calculation for the Defender (Example 14.4)
Figure 14.9 Cash flow diagram for defender when N = 4 years (Example 14.4).
Table 14.3 Economic Service Life Calculation for the Challenger (Example 14.4)
Figure 14.10 Marginal cost of keeping the defender for one more year beyond its economic service life.
Figure 14.11 Some likely replacement patterns under a finite planning horizon of eight years (Example 14.5).
Figure 14.12 Graphical representations of replacement strategies under a finite planning horizon (Example 14.5).
Figure 14.13 Net proceeds from the sale of the old printing machine—defender (Example 14.6).
Table 14.4 Replacement Worksheet: Option 1—Keep the Defender (Example 14.7)
Table 14.5 Replacement Worksheet: Option 2—Replace the Defender (Example 14.7)
Figure 14.14 Comparison of defender and challenger on the basis of the opportunity cost approach (Example 14.7).
Table 14.6 Calculation of Net Proceeds from Sale as a Function of Holding Period (Example 14.8)
Table 14.7 After-Tax Cash Flow Calculation for Owning and Operating the Asset for Two Years
Figure 14.15 Economic service life obtained by finding the minimum AEC (Example 14.8). Note that we treat the cost items with a positive sign.
Table 14.8 Economic Service Life Calculation Based After-Tax (Example 14.8) continued on next slide
Table 14.8 (continued) Economic Service Life Calculation Based After-Tax (Example 14.8) continued on next slide
Table 14.8 (continued) Economic Service Life Calculation Based After-Tax (Example 14.8)
Table 14.9 Economics of Retaining the Defender for N More Years (Example 14.9) continued on next slide
Table 14.9 (continued) Economics of Retaining the Defender for N More Years (Example 14.9)
Table 14.10 Economics of Owning and Operating the Challenger for N More years (Example 14.9) continued on next slide
Table 14.10 (continued) Economics of Owning and Operating the Challenger for N More years (Example 14.9) continued on next slide
Table 14.10 (continued) Economics of Owning and Operating the Challenger for N More years (Example 14.9)
Figure 14.16 Equivalent annual cash-flow streams when the defender is kept for n years followed by infinitely repeated purchases of the challenger every four years (Example 14.9).
Table ST14.4 continued on next slide