Download
1 / 23
280 likes | 513 Views
Government Budget. Do Deficits & Debt Matter?. Federal Gov’t Taxes. Federal Income Tax Progressive Tax: tax rate increases as income increases Social Security Tax- 6.2% of salary on first $110,000 income Why: Gov’t pension starting at 65 (or older) Medicare Tax 1.45% of entire salary

E N D
Government Budget Do Deficits & Debt Matter?
Federal Gov’t Taxes • Federal Income Tax • Progressive Tax: tax rate increases as income increases • Social Security Tax- • 6.2% of salary on first $110,000 income • Why:Gov’t pension starting at 65 (or older) • Medicare Tax • 1.45% of entire salary • Why: Gov’t health insurance starting at 65
Federal Income Tax • Progressive Income Tax As income% Tax Rate 2013 TAX BRACKETS
The Government Budget Government Revenue Government Spending All Gov’t Expenses Taxes
2013 Budget Summary • Spending: $3.685 Trillion dollars • Revenue $2.712Trillion (from taxes) • Deficit: $973 Billion • Debt: $17.0 Trillion
43% of Budget 24% of Budget Government Spending • Social Security 22.0% • Medicare 14.0% • Medicaid 7.0% • Interest on Debt 6.0% • Defense Spending 18.0% • Homeland Security 1.0% • Education 2.0% • Other 26.0 • Total100.0%
THANK YOU!
US Demographics • America’s population is aging • smaller young (echoboomer) generation • Babyboomers beginning to retire • By 2040 1 in 4 Americans will be over 65 • Average life span has risen • 77 years men, 81 years women • why: advances in medical technology, nutrition, etc… • This FACT ensures that entitlement spending will increase a rapidly growing rate
Entitlement Spending • Includes- Social Security, Medicare & Medicaid • Citizens are “entitled” to benefits at 65 years of age • Largest part of Government budget • Consumes approximately 40% of budget in 2011! • Projected to 60%-70% by 2040!
Not Enough Workers? • The ratio of workers to retirees is falling • This means less money coming in => more going out
Wake-Up Call Video http://www.cbsnews.com/stories/2007/03/01/60minutes/main2528226.shtml
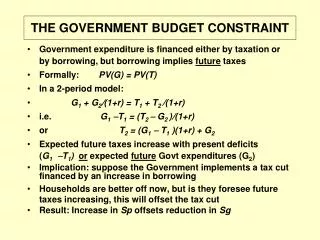
Deficit & Debt relative to GDP • Current Deficit = 973 Billion (2013 numbers) • Current Debt = 17.2 Trillion • Current GDP = 16.6 Trillion • Deficit as % of GDP = 6.0% of GDP • Highest since World War II • Recent high (1983) 6% of GDP • Debtas % of GDP =102.0% of GDP • Highest ever (1946) was 120% of GDP
NATIONAL DEBT AS % OF GDP Debt: 17.0 Trillion GDP 16.6 Trillion 102 % GDP .
Growth of Entitlements . . 1964 1984 2004* 19% 9% Social Security Medicare & Medicaid Defense All other spending Net interest *Current services estimate. Source: Budget of the United States Government, FY 2005, Office of Management and Budget.
Balancing the Budget? “The only real question” is whether adjustments to taxes and spending will come from a “careful and deliberative process” or from a “rapid and painful response to a looming or actual fiscal crisis,” Ben Bernanke 2010
Changing EntitlementsSocial Security, Medicare & Medicaid Social Security Medicare
$470 Billion spent per year $50 Billion stolen?
U.S. Debt in Comparison • Japan: 190% of GDP(1970: 10% of GDP) • $56,000 per person • France80% of GDP • Deficit 7.5% of GDP • Italy 115% of GDP • Deficit 8.0% of GDP • European Union (EU) debt limit of 60% • Deficit limit: 3.0% of GDP
. Debt as a % of GDP